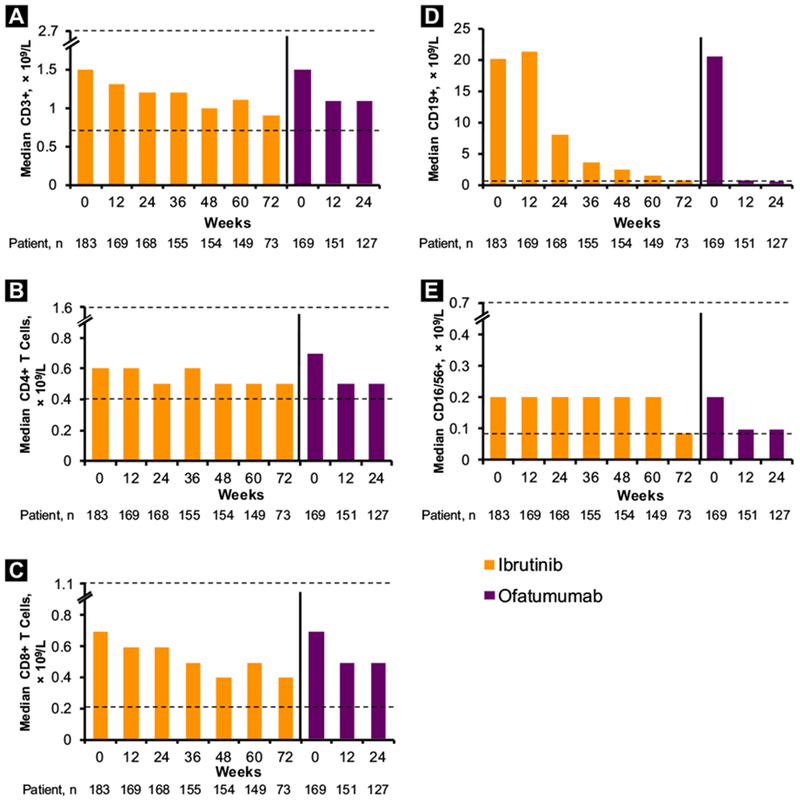
Figure 3.

Absolute Counts Over Time of CD3+ (A), CD4+ (B), CD8+ (C), CD19+ (D), and CD16/56+ (E) Cells. ULN and LLN (× 109/L): CD3+, 0.723-2.737; CD4 + , 0.404-1.612; CD8+, 0.22-1.129; CD19+ , 0.08-0.724; and CD16/56+, 0.084-0.724. In Each Chart, ULN and LLN are Shown by Dashed Lines (With Axis Breaks); Only Uln is Shown for CD19+ Cells
Abbreviations: LLN = lower limit of normal; ULN = upper limit of normal.
