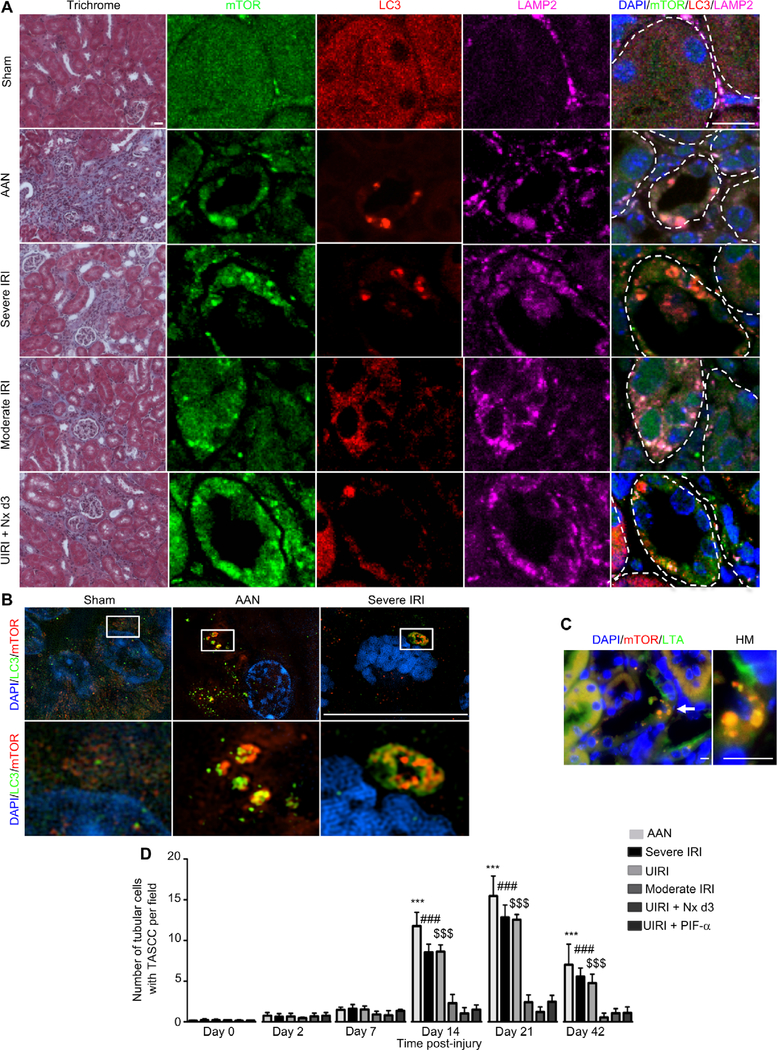
Fig. 1. TASCC formation is seen in kidney tubular cells after injury.
(A) Morphology (trichrome) of BALB/c mouse kidneys with colocalization of mTOR, LC3, and LAMP2 in the different models of kidney injury 21 days after initiation of the injury. Tubules are delineated with dotted lines. (B) Super-resolution imaging of kidney tissue from sham-operated mice, mice treated with AA, and mice exposed to severe IRI, stained for LC3 and mTOR. Pictures are representative of n = 6 mice per group. (C) Coimmunostaining for mTOR and LTA in AA-treated mouse kidney tissue. Injured cells with TASCC formation are not stained with LTA due to dedifferentiation but are adjacent to differentiated neighboring cells positively stained with LTA. (D) Quantification of TASCC formation observed in tubular cells per field (×400) in the different models of murine kidney injury (n = 6 at each time point). AAN, AA nephropathy; Nx, contralateral nephrectomy; HM, high magnification. Scale bars, 20 μm (trichrome) and 10 μm [immunofluorescence (IF)]. Data are means ± SEM. Mann-Whitney test: ***P < 0.001, vehicle-treated mice versus AA-injected mice; ###P < 0.001, sham IRI versus severe IRI; $ $ $P < 0.001, sham IRI versus UIRI.

