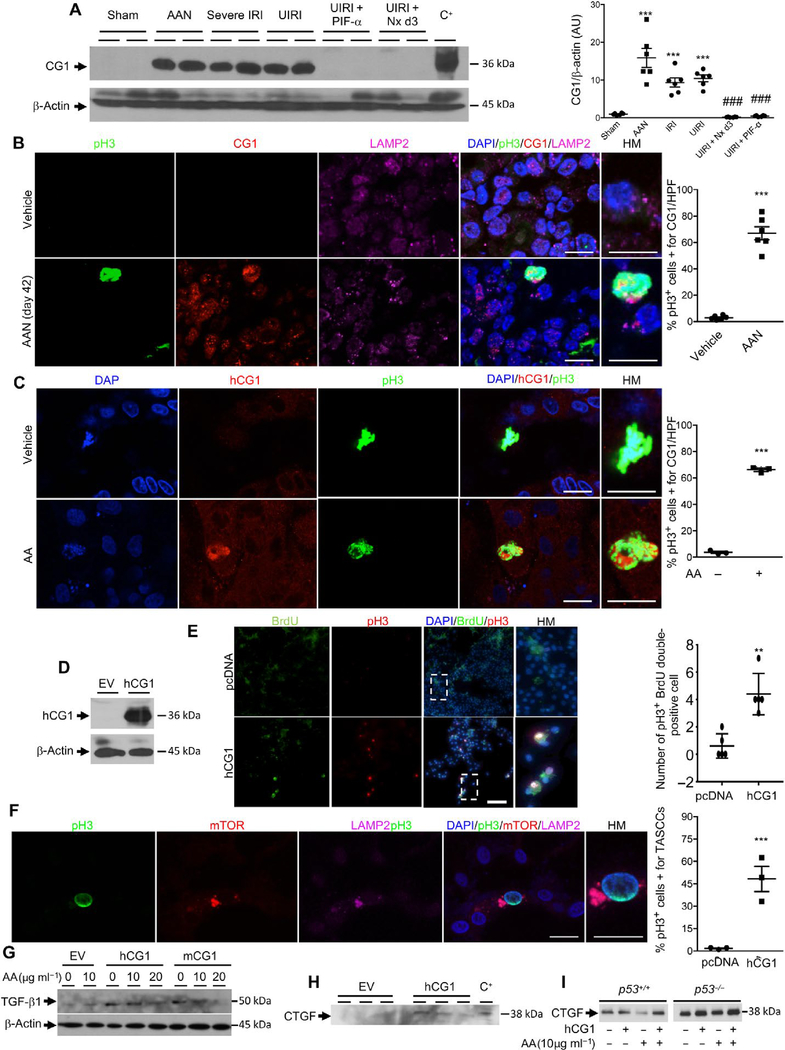
Fig. 3. Kidney proximal tubule cells arrested in G2-M express CG1.
(A) Western blot and quantification of CG1 in mouse kidneys 21 days after various injuries (n = 6 animals per group). HEK-293 cells transfected with murine CG1 served as positive control (C+) for CG1 molecular weight. ***P < 0.001 placebo versus AAN, IRI, UIRI. ###P < 0.001 UIRI + Nx d3 and UIRI + PIF-A versus AAN, IRI, UIRI. (B) Colocalization and quantification of pH3, CG1, and LAMP2 in mouse kidneys 21 days after vehicle or AA injection (n = 6 animals per group). ***P < 0.001 vehicle versus AAN. (C) Colocalization of pH3 and CG1 in HK-2 cells after 48 hours of vehicle or AA treatment. Quantification of the percentage of cells costained for pH3 and CG1 per high-powered field (×600) (n = 3 independent experiments). ***P < 0.001 HK-2 vehicle versus HK-2 AA. (D) Western blot of CG1 in HK-2 cells transfected with a pCMV empty vector (EV) or the human form of CG1 (hCG1) (n = 3 independent experiments). (E) HK-2 cells transfected with pCMV EV or vector encoding human CG1 (hCG1), pulse-labeled with BrdU for 3 hours and then fixed 8 hours later. Cells were then stained for BrdU incorporation and pH3. P = 0.0013 (n = 5). (F) Representative images and quantification of coimmunostaining of pH3, mTOR, and LAMP2 in HK-2 cells transfected with hCG1 (n = 3 independent experiments). ***P < 0.001 pcDNA versus hCG1. (G) Western blot of TGF-β1 in HK-2 cells transfected with EV, hCG1, or mCG1 (mouse CG1) after 48 hours of vehicle or AA treatment (n = 3 independent experiments). (H) Western blot of CTGF secretion into the supernatant of HK-2 cells 48 hours after transfection with either EV- or vector-encoding hCG1 (n = 3 independent experiments). HEK-293 cells transfected with the mouse form of hCG1 served as positive control for CTGF molecular weight (C+). (I) HTC-116 p53 wild-type and knockout cells treated with AA with or without transfection with hCG1. Data are means ± SEM. (A) Analysis of variance (ANOVA)-Tukey’s post hoc test. (B to I) Student’s t test. Scale bars, 10 μm (B), (C), and (F); 100 μm (E).

