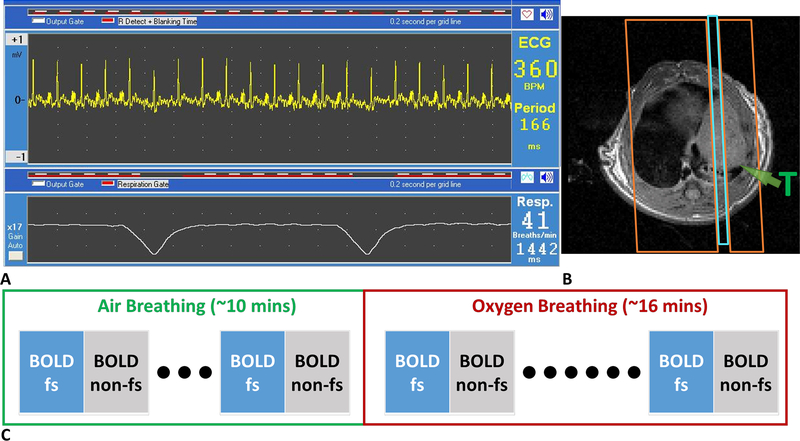
Figure 1. BOLD experiment design to assess flow sensitivity.
A. ECG and respiration trigger setting. B. Placement of spatial saturation bands (orange boxes) on both sides of imaging plane (blue box). Green arrow indicates a single nodular tumor in the lung. C. The scan scheme shows the interleaved acquisition of BOLD with and without flow suppression (fs).

