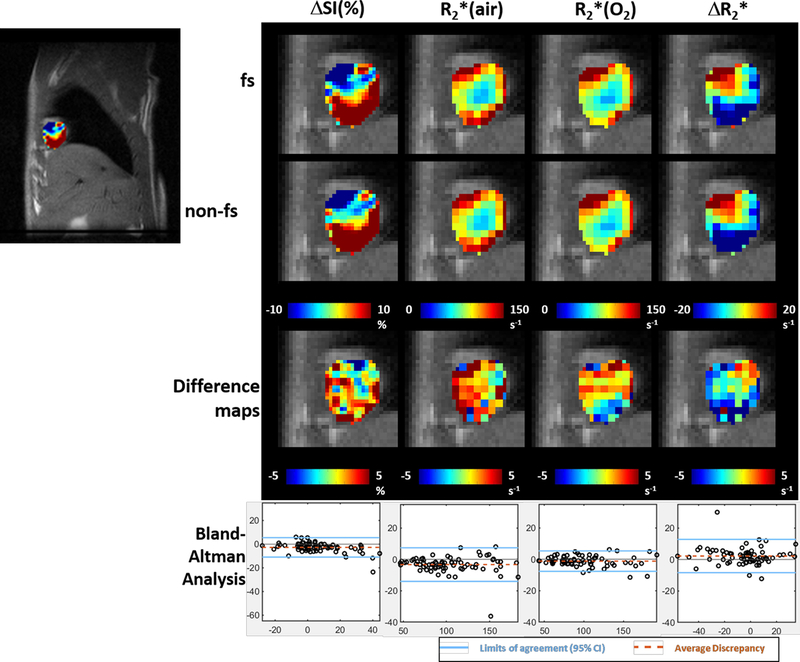
Figure 4. Parametric maps of an H460 lung tumor showed high similarity in spatial patterns.
Far left ΔSI(%) map overlaid on sagittal image of orthotopic lung tumor. Color images show expanded parametric maps: from left to right: ΔSI(%), R2*(air), R2*(oxygen) and ΔR2*. From top to bottom: maps with fs, without fs, difference maps (non-fs minus fs), Bland-Altman analysis on voxels from the maps. In Bland-Altman plot, y-axis is the difference of measurements from the two settings and x-axis is the average of the two settings. Solid blue lines show the limits of agreement which is defined at 95% confidence interval and the dotted orange lines represent the average discrepancy.

