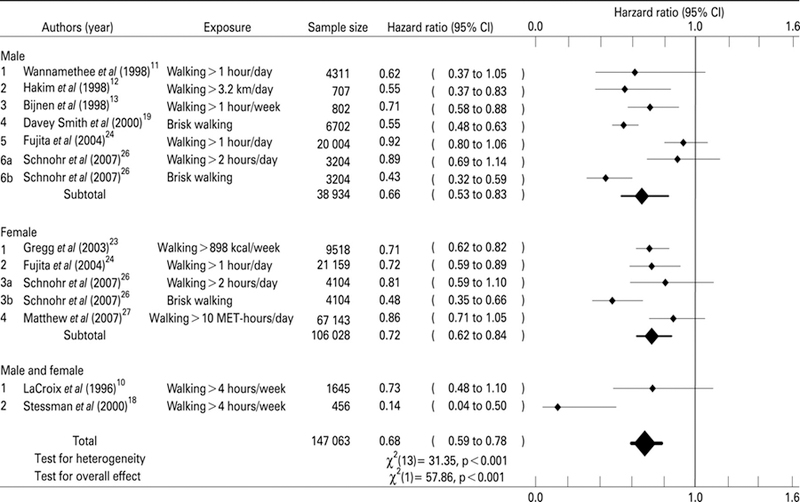
Figure 1. The Association Between Walking and All-Cause Mortality in Men and Women.

Source: M Hamer, and Y Chida, 2008 (9). Forest plot showing point and 95% confidence interval estimates of the HR for all-cause mortality associated with different amounts of PA. Relative influence on the pooled results/effect sizes are represented by varying line weights of the symbols. Walking is favored, with a shift of the estimate to the left. These estimates are similar to the associations found for CVD mortality discussed later.
