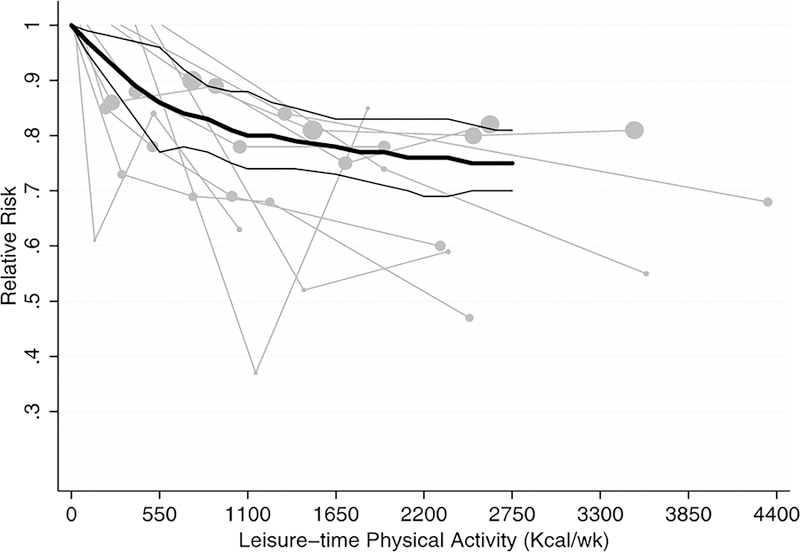
Figure 4. Plot with Spline and 95% Confidence Intervals of Relative Risk of Coronary Heart Disease by Kcal Per Week of Leisure-time Physical Activity.

Source: Sattelmair et al., 2011 (27). This summary of the synthesis of nine studies displays the characteristics of this dose-response relationship with all-cause mortality as shown and discussed in Figure 2.
