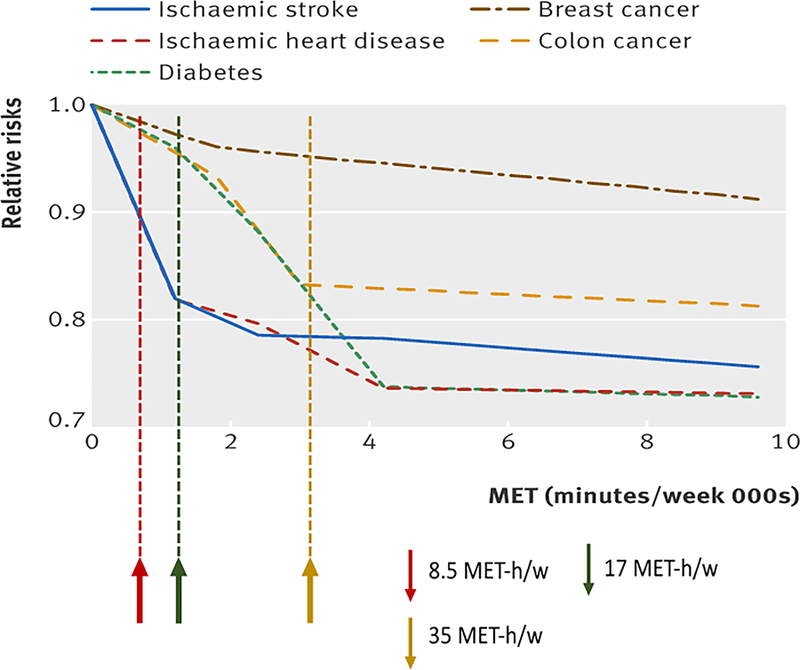
Figure 5. Dose-Response Relationships Between Total Physical Activity and Risk of Breast Cancer, Colon Cancer, Diabetes, Ischemic Heart Disease, and Ischemic Stroke Events Using 174 Studies (43 For Ischemic Heart Disease, and 26 For Ischemic Stroke).

Adapted from Kyu, 2016 (25). For reference, shown are the lower end (red arrows and dotted line) and upper bounds (green arrows and dotted line) of the 2008 Guidelines for moderate-to-vigorous physical activity. Also indicated is the moderate-to-vigorous physical activity amount associated with normalization of the risk from >8h per day of sedentary activity from Ekelund, 2016 (8) (gold arrows and dotted line). The latter would represent the amount of physical activity required to compensate for an entirely sedentary lifestyle. The risk for ischemic heart disease and ischemic stroke are reminiscent of the characteristic dose-response relationships established for all-cause and cardiovascular mortality noted previously and in Figure 2. The universality of the dose-response relationships described in the caption of Figure 2 to other outcomes — such as type 2 diabetes and some cancers — are shown in this figure.
