Figure 1.
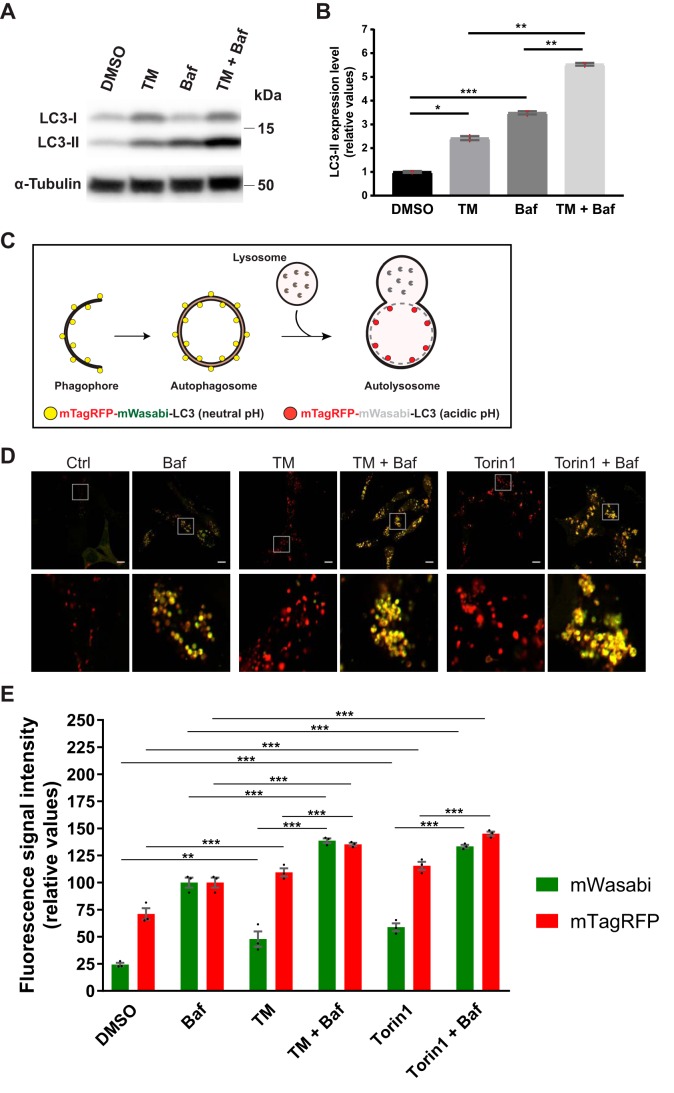
TM increases autophagic membrane flux in LNCaP cells. A, LNCaP cells were treated as indicated for 24 h, with Baf included the last 3 h only. Subsequently, protein extracts were prepared and subjected to immunoblotting for LC3 and α-tubulin as indicated. B, protein levels from three independent experiments as in A were quantified and normalized against α-tubulin (mean ± S.E. (error bars), n = 3). Red dots represent individual data points. Statistical significance was evaluated using repeated measures one-way ANOVA. *, p < 0.05; **, p < 0.01; ***, p < 0.001. C, illustration depicting the principle for the tandem fluorescent LC3 assay; mTagRFP-mWasabi-LC3 attached to phagophores and autophagosomes will be in an environment of neutral pH and therefore appear as yellow puncta (mix of green and red fluorescence). In contrast, mTagRFP-mWasabi-LC3 molecules that have reached the autolysosome will appear as red puncta because the green fluorescence from mWasabi, but not that from mTagRFP, is quenched in the acidic environment. D, LNCaP cells stably expressing mTagRFP-mWasabi-LC3 were treated for 24 h, as indicated, with Baf and Torin1 included the last 3 h only. Subsequently, cells were analyzed by live-cell fluorescence confocal microscopy. A representative image is shown for each treatment condition, and the white square insets in the top panels are shown in larger magnification in the bottom panels. Scale bar, 10 μm. E, LNCaP cells stably expressing mTagRFP-mWasabi-LC3 were treated for 24 h, as indicated, with Baf and Torin1 included the last 3 h only. Subsequently, cells were detached from the tissue culture plate and briefly treated with digitonin to permeabilize the plasma membrane and thereby deplete the cells of unconjugated, cytosolic mTagRFP-mWasabi-LC3 while preserving the conjugated, membrane-bound mTagRFP-mWasabi-LC3. Thereafter, the cells were analyzed for mWasabi and mTagRFP fluorescence intensity by flow cytometry. The results from three independent experiments are shown (mean ± S.E., n = 3). Black dots represent individual data points. Statistical significance was evaluated using repeated measures one-way ANOVA. **, p < 0.01; ***, p < 0.001.

