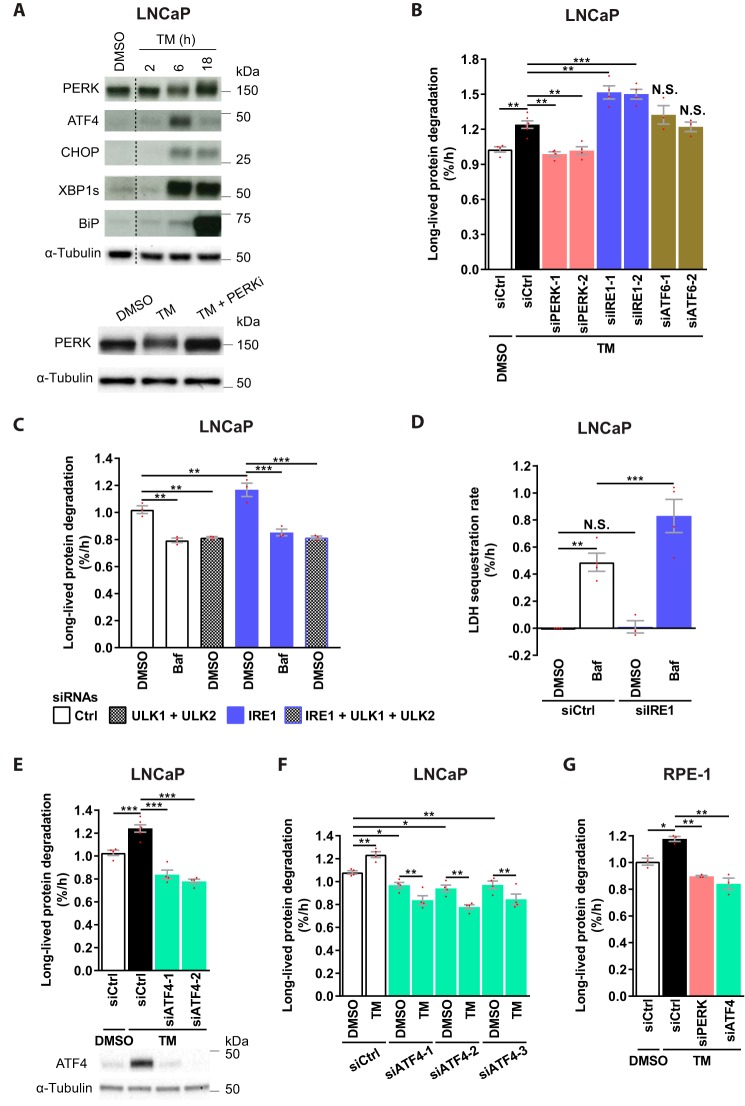
Figure 5.
PERK and ATF4 are essential, whereas IRE1 restricts ER stress–induced autophagy. A, LNCaP cells were treated as specified and immunoblotted for the indicated proteins. Upward mobility shift in the PERK band reflects PERK phosphorylation, as verified in the bottom panel; PERKi reverses the shift. One representative of two independent experiments is shown. The blots were spliced at the locations indicated by the dotted lines. B–G, LNCaP (B–F) or RPE-1 (G) were transfected with the indicated siRNAs and treated as specified for 24 h (B, E, and F), 6 h (C), 4 h (D), or 22 h (G). LLPD was measured at 18–24 h (B, E, and F), 0–6 h (C), or 18–22 h (G). LDH sequestration was determined after 4 h of DMSO or Baf treatment (D). Results are the mean ± S.E. (error bars), n ≥ 3 (B), n = 3 (C and G), n ≥ 3 (D), n ≥ 4 (E), n = 4 (F). Red dots represent individual data points. Statistical significance was evaluated using regular (B and E) or repeated measures (G) one-way ANOVA and regular (D) or repeated measures (C and F) two-way ANOVA. *, p < 0.05; **, p < 0.01; ***, p < 0.001. N.S., not significant.

