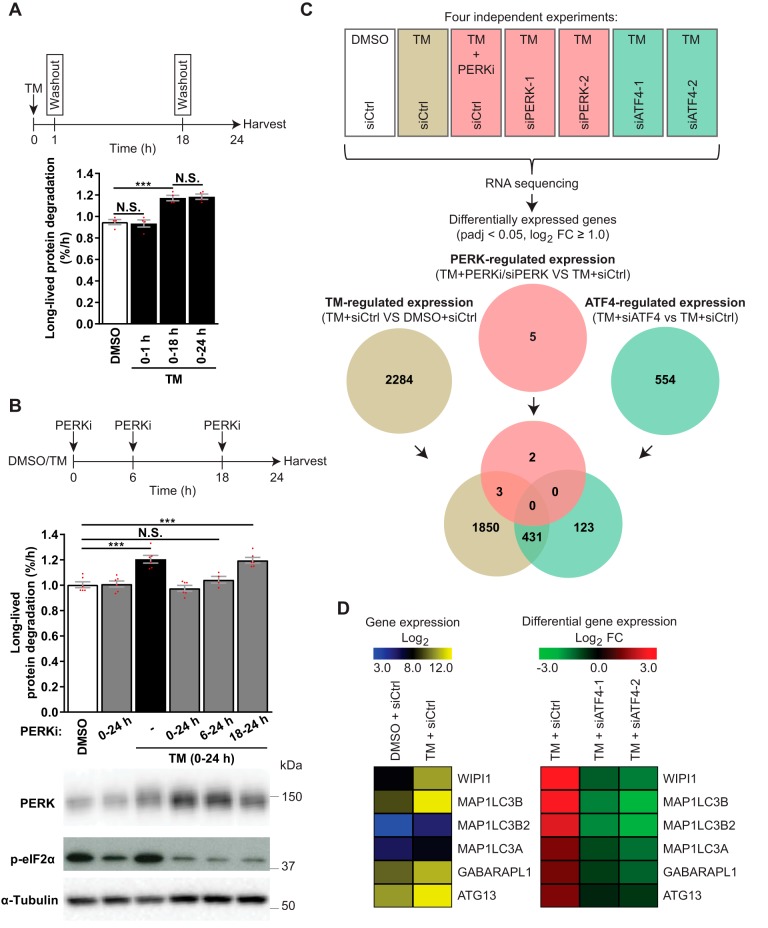
Figure 6.
ATF4 regulates gene expression independently of PERK in TM-treated LNCaP cells. A, LNCaP cells were treated with DMSO for 24 h or with TM, which was washed out and replaced with DMSO after 1 h (0–1 h) or 18 h (0–18 h) or kept throughout (0–24 h). LLPD was measured at 18–24 h (mean ± S.E. (error bars), n = 4). B, LNCaP cells were treated as indicated, with PERKi present in the specified time periods. LLPD was measured at 18–24 h (mean ± S.E., n ≥ 4). Immunoblotting validated PERK inhibition by PERKi. C, LNCaP cells were siRNA-transfected, followed by treatment for 18 h, as indicated, and subjected to RNA-Seq. The Venn diagram displays the numbers and overlap of differentially expressed genes (padj < 0.05, log2 FC ≥ 1) in TM-treated siCtrl cells versus DMSO siCtrl cells (brown) and in TM-treated siCtrl cells versus TM-treated cells suppressed/silenced for PERK (red) or ATF4 (green) (n = 4). Genes were considered to be PERK-regulated (red) when mRNA expression was significantly altered (padj < 0.05, log2 FC ≥ 1.0) by all PERK-interfering conditions (PERKi, siPERK-1, and siPERK-2). Genes were considered to be ATF4-regulated (green) when mRNA expression was significantly altered (padj < 0.05, log2 FC ≥ 1.0) by all ATF4-interfering conditions (siATF4-1 and siATF4-2). The analysis was performed in this manner to eliminate genes that were altered due to nonspecific/off-target effects from chemical and genetic interference with PERK and ATF4. D, heat map depictions of RNA-Seq data for the six ATG genes whose expression was up-regulated more than 2-fold by TM (padj < 0.05). Left, normalized log2 reads count (expression). Right, log2 FCs of TM + siCtrl versus DMSO + siCtrl, and TM + siATF4–1 or -2 versus TM + siCtrl (differential expression). Red dots represent individual data points. Statistical significance was evaluated using repeated measures (A) or regular (B) one-way ANOVA or DESeq2 version 1.10.1 Bioconductor package (C and D). ***, p < 0.001. N.S., not significant.

