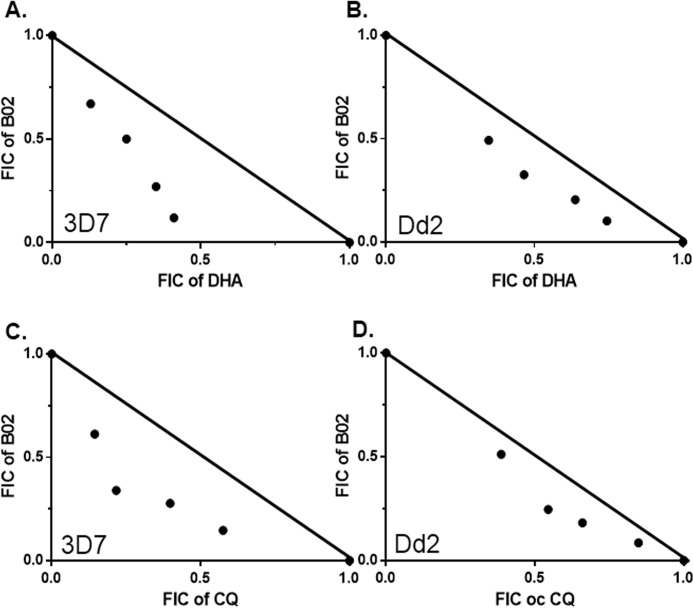
Figure 6.
Synergy of DHA and CQ with recombinase inhibitor B02. A and B, isobologram of DHA–B02 combination in 3D7 and Dd2 strains, respectively. C and D, isobologram of CQ–B02 combination in 3D7 and Dd2 strains, respectively. Fixed-ratio drug combination assays were performed. FIC, fraction inhibitory concentration. Each point represents the mean IC50 of drug combination from three independent experiments. The solid line is plotted between the IC50 values of each drug when used alone to emphasize the concave nature of the isobolograms.

