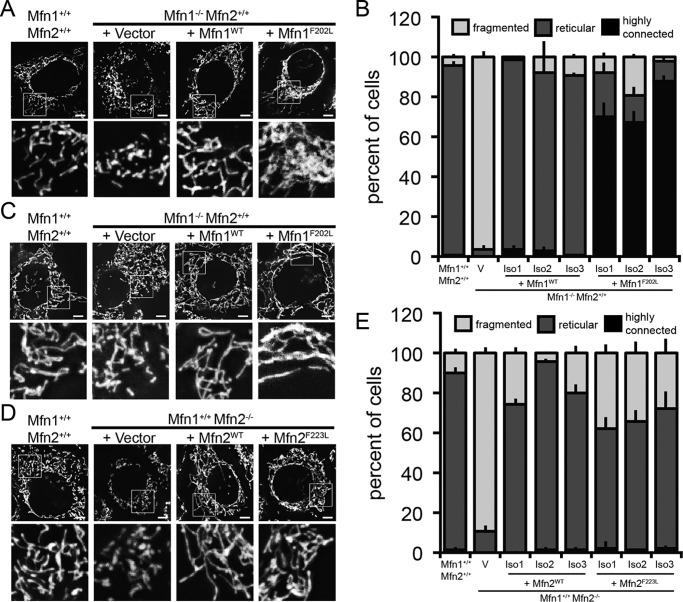
Figure 2.
Mfn1F202L and Mfn2F223L support mitochondrial fusion when expressed in Mfn1-null and Mfn2-null cells, respectively. A, representative images of clonal populations of Mfn1−/−Mfn2+/+ cells either transduced with empty vector (V) or stably expressing Mfn1-FLAG or Mfn1F202L-FLAG. Mitochondria were labeled with MitoTracker Red CMXRos and visualized by fluorescence microscopy. Images represent maximum intensity projections. Scale bars are 5 μm. The Vector panel is representative of a cell with a fragmented mitochondrial network; the WT and Mfn1-FLAG cells are representative of cells with a reticular mitochondrial network; the Mfn1F202L cell is representative of a cell with a highly connected network. B, quantification of the mitochondrial morphology of cell lines described in A. Error bars indicate mean + S.D. from three blinded experiments (n > 100 cells per cell line per experiment). C, representative images of clonal populations from A treated with 1.5 nm nocodazole for 1 h. Mitochondria were labeled with MitoTracker Red CMXRos and visualized by fluorescence microscopy. Images represent maximum intensity projections. Scale bars are 5 μm. D, representative images of clonal populations of Mfn1+/+ Mfn2−/− cells stably either transduced with empty vector (V) or expressing Mfn2-FLAG or Mfn2F223L-FLAG. Mitochondria were labeled with MitoTracker Red CMXRos and visualized by fluorescence microscopy. Images represent maximum intensity projections. Scale bars are 5 μm. E, quantification of the mitochondrial morphology of cell lines described in D. Error bars indicate mean + S.D. from three blinded experiments (n > 100 cells per cell line per experiment).

