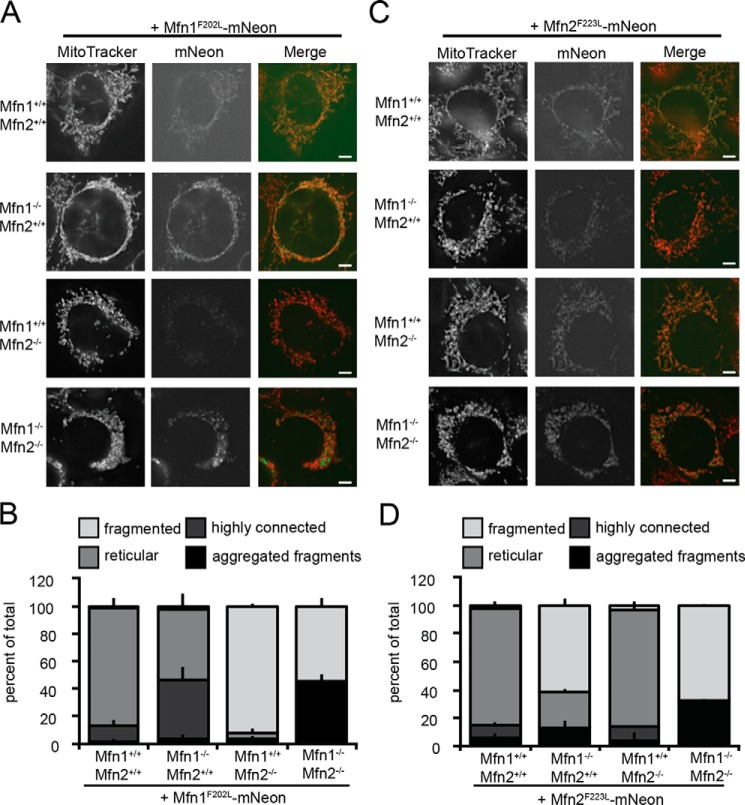
Figure 3.
Mfn1F202L and Mfn2F223L only support fusion in heterotypic complexes. A, representative images of the indicated cell lines stably expressing Mfn1F202L-mNeon. Mitochondria were labeled with MitoTracker Red CMXRos and visualized by fluorescence microscopy. Images represent maximum intensity projections. Scale bars are 5 μm. B, quantification of the mitochondrial morphology of cell lines described in A. Error bars indicate mean + S.D. from three blinded experiments (n > 100 cells per cell line per experiment). C, representative images of the indicated cell lines stably expressing Mfn2F223L-mNeon. Mitochondria were labeled with MitoTracker Red CMXRos and visualized by fluorescence microscopy. Images represent maximum intensity projections. Scale bars are 5 μm. D, quantification of the mitochondrial morphology of cell lines described in C. Error bars indicate mean + S.D. from three blinded experiments (n > 100 cells per cell line per experiment).

