Figure 7.

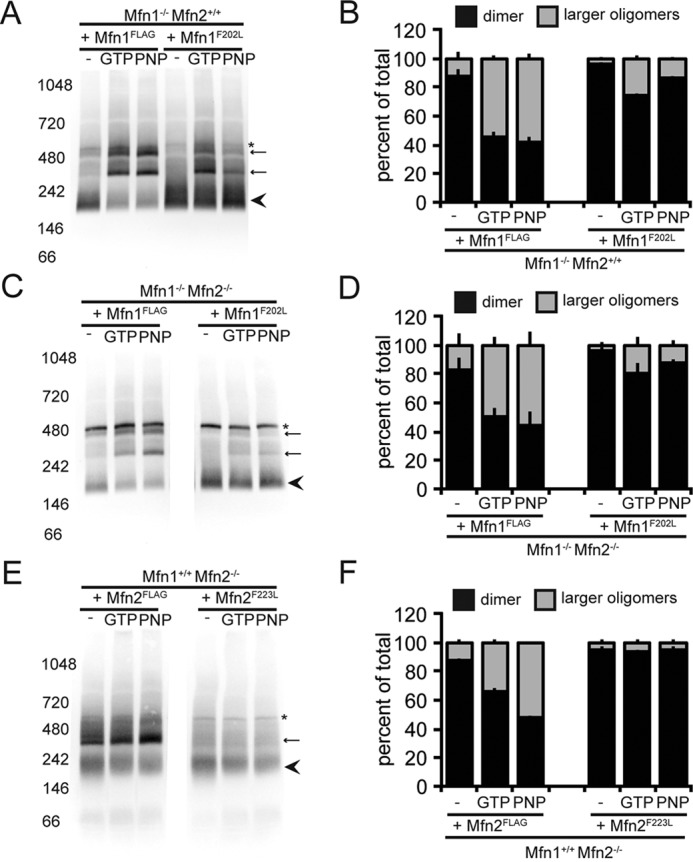
Mfn1F202L has impaired nucleotide-dependent assembly. A, mitochondria were isolated from a clonal population of Mfn1WT-expressing Mfn1-null cells (Mfn1WT Mfn2+/+) and a clonal population of Mfn1F202L-expressing Mfn1-null cells (Mfn1F202L Mfn2+/+). Mitochondria were either not treated or incubated with the specified nucleotide prior to lysis and then subjected to BN-PAGE and immunoblotting with α-FLAG. The arrowhead denotes the predicted dimer state, arrows denote the larger oligomeric species, and * denotes a nonspecific band. B, the percentage of total protein in the smaller oligomeric state (arrowhead) (predicted dimer) and the higher oligomeric states (arrows) for each condition in A is represented in the bar graph as mean + S.D. of three independent experiments. C, mitochondria were isolated from a clonal population of Mfn1WT-expressing Mfn1/2 double-null cells (Mfn1WT Mfn2−/−) and a clonal population of Mfn1F202L-expressing Mfn1/2 double-null cells (Mfn1F202L Mfn2−/−). Mitochondria were either not treated or incubated with the specified nucleotide prior to lysis and then subjected to BN-PAGE and immunoblotting with α-FLAG. The arrowhead denotes the predicted dimer state, arrows denote the larger oligomeric species, and * denotes a nonspecific band. D, the percentage of total protein in the smaller oligomeric state (arrowhead) (predicted dimer) and the higher oligomeric states (arrows) for each condition in C is represented in the bar graph as mean + S.D. of three independent experiments. E, mitochondria were isolated from a clonal population of Mfn2WT-expressing Mfn2-null cells (Mfn1+/+ Mfn2WT) and a clonal population of Mfn2F223L-expressing Mfn2-null cells (Mfn1+/+ Mfn2F223L). Mitochondria were either not treated or incubated with the specified nucleotide prior to lysis and then subjected to BN-PAGE and immunoblotting with α-FLAG. The arrowhead denotes the predicted dimer state, an arrow denotes the larger oligomeric species, and * denotes a nonspecific band. F, the percentage of total protein in the smaller oligomeric state (arrowhead) (predicted dimer) and the higher oligomeric states (arrow) for each condition in E is represented in the bar graph as mean + S.D. of three independent experiments. PNP, GMPPNP.
