Figure 4.
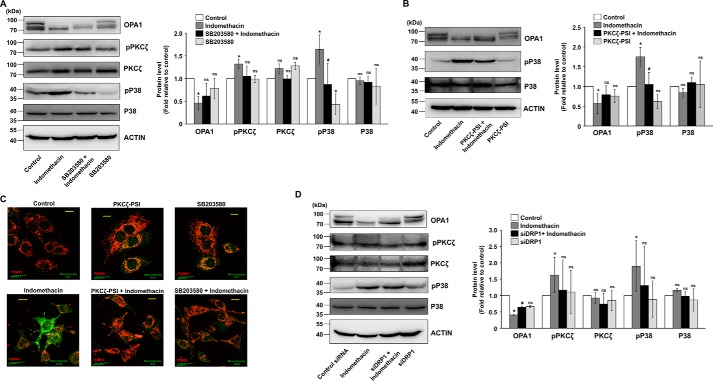
Blocking p38 activation or PKCζ activation affects indomethacin-induced PKCζ–p38 MAPK signaling and prevents fissogenic DRP1 activation. A, immunoblot analysis of OPA1, phospho-PKCζ, PKCζ, phospho-p38 and p38 in the whole-cell lysates from control and SB203580-treated AGS cells. Actin was used as the loading control for cell lysates. Bar graphs adjacent to the blots represent the densitometric analyses of the immunoblot data after normalization with actin. B, immunoblot analysis of OPA1, phospho-p38, and p38 in the whole-cell lysates from control and PKCζ–PSI-pretreated, indomethacin-treated AGS cells. Actin was used as the loading control for cell lysates. Numerical values at the side of the blots indicate the positions of corresponding molecular mass markers. Bar graphs adjacent to the blots represent the densitometric analyses of the immunoblot data after normalization with actin. C, confocal microscopy to follow the level of Ser-616 phosphorylation of DRP1 in control, indomethacin-treated, PKCζ–PSI-treated, PKCζ–PSI-pretreated indomethacin-treated, SB203580-treated, and SB203580-pretreated indomethacin-treated AGS cells. Scale bars correspond to 10 μm, 80–100 cells were randomly screened, and a single cell was randomly selected for precise demonstration of mitochondrial localization of pDRPSer-616 (green) at the single-cell level. Mitochondria (red) were immunostained by anti-TOM20 antibody. A representative image of one of several experiments performed has been presented. Mean intensity values corresponding to p pDRP1Ser-616 are indicated in each image. D, immunoblot analysis of OPA1, phospho-PKCζ, PKCζ, phospho-p38, and p38 in the whole-cell lysates from control and siDRP1-treated AGS cells. Actin was used as the loading control for cell lysates. Numerical values at the side of the blots indicate the positions of corresponding molecular mass markers. Bar graphs adjacent to the blots represent the densitometric analyses of the immunoblot data after normalization with actin. All experiments were done in triplicate. *, p < 0.05 versus control, and #, p < 0.05 versus indomethacin calculated by ANOVA followed by Bonferroni's post hoc test. ns, not significant. A detail of each method is described under “Experimental procedures.”

