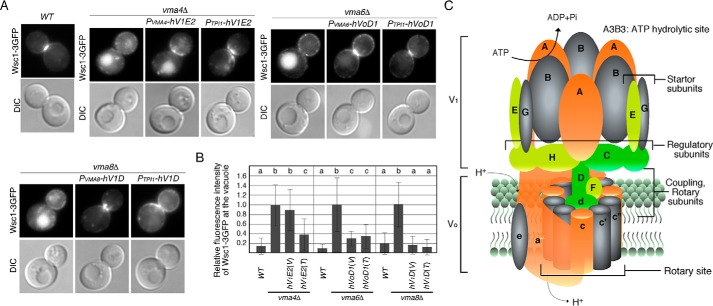
Figure 7.
Recycling of Wsc1–3GFP in yeast V-ATPase subunit mutants expressing the equivalent human gene. A, localization of Wsc1–3GFP in WT and vma mutants. Cells expressing Wsc1–3GFP were grown to early logarithmic phase in YPD medium at 25 °C and observed by epifluorescence and differential interference contrast (DIC) microscopy. B, quantification of the fluorescence intensity of Wsc1–3GFP at the vacuole in WT and mutant cells. The fluorescence intensity of Wsc1–3GFP at the vacuole was calculated by subtracting average fluorescence intensity in the cytosol from that in the vacuole. For the relative fluorescence intensity in mutants, the average fluorescence intensity in mutant cells was divided by the average fluorescence intensity in WT cells. Data show the mean ± S.D., with >50 cells counted for each strain. Different letters indicate significant difference at p < 0.01 (one-way ANOVA with Tukey's post-hoc test). C, schematic representation of the subunit structure of yeast V-ATPase (2, 28). The subunits whose function were mostly complemented by the corresponding human subunits are shown in green, partially complemented are shown in yellow, and slightly complemented are shown in orange. The subunits that were not complemented are shown in gray.

