Figure 1.
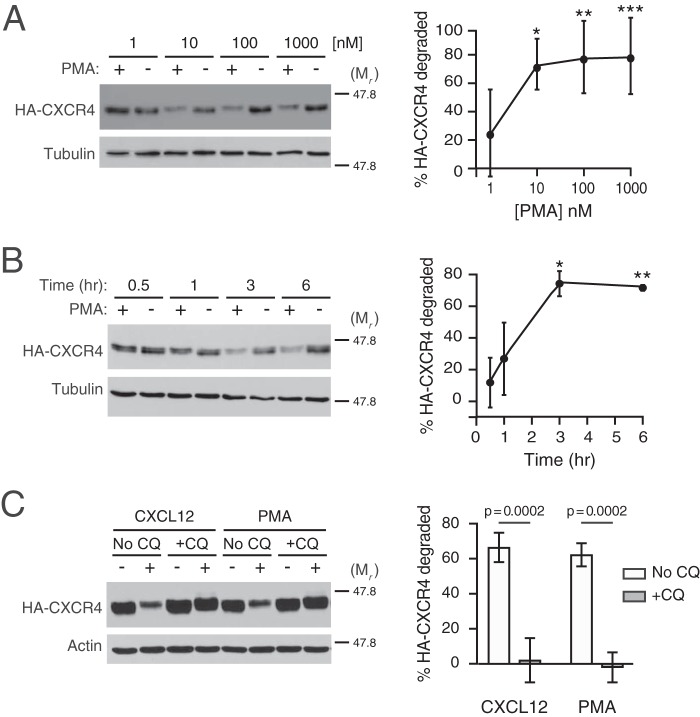
Characterization of PMA-mediated CXCR4 degradation. A and B, HEK293 cells stably expressing HA-CXCR4 were treated with increasing doses of PMA for 3 h (n = 6) (A) or for the indicated times with 10 nm PMA (n = 3) (B). Graphs represent the average amount of HA-CXCR4 degraded compared with its vehicle control at each dose (A) or time (B) ± S.D. Data were analyzed by one-way ANOVA, followed by Tukey's post hoc test. In A, the adjusted p values are for the following comparisons: 1 and 10 nm, * = 0.0185; 1 and 100 nm, ** = 0.0088; 1 and 1000 nm, *** = 0.0078. In B, the adjusted p values are for the following comparisons: 0.5 and 3 h, * = 0.0032; 0.5 and 6 h, ** = 0.0042. C, HEK293 cells stably expressing HA-CXCR4 were pretreated with 100 μm chloroquine (+CQ) or not (No CQ) for 30 min before treatment with 10 nm CXCL12, 10 nm PMA, or corresponding vehicle (n = 3) for 3 h. Representative immunoblots are shown. The positions of the molecular weight markers are indicated. Average percentage degradation of HA-CXCR4 was calculated as described under “Experimental procedures.” Error bars, S.D. In C, data were analyzed by two-way ANOVA, followed by Tukey's post hoc test. Adjusted p values are indicated.

