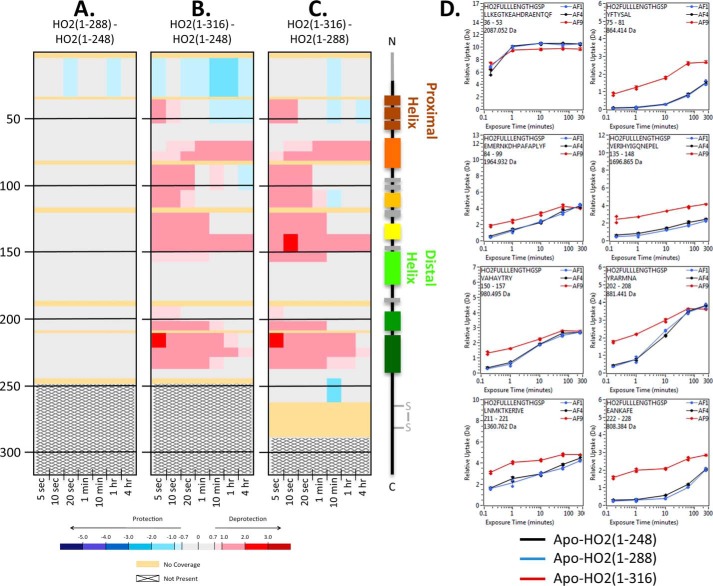
Figure 4.
HDX-MS comparisons of the apo states of HO2 constructs with various lengths of C-terminal residues. A, the impact of residues 249–288 on the apo state of HO2. Deuterium differences were calculated from Dapo HO2(1–288) − Dapo HO2(1–248) and colored according to the scale shown. B, the impact of residues 249–316 on the apo state of HO2. Deuterium differences were calculated from Dapo HO2(1–316) − Dapo HO2(1–248) and colored according to the scale shown. C, the impact of residues 289–316 on the apo state of HO2. Deuterium differences were calculated from Dapo HO2(1–316) − Dapo HO2(1–288) and colored according to the scale shown. D, representative deuterium incorporation graphs for regions where differences were observed in A–C. All data used to create this figure can be found in Excel File S1.

