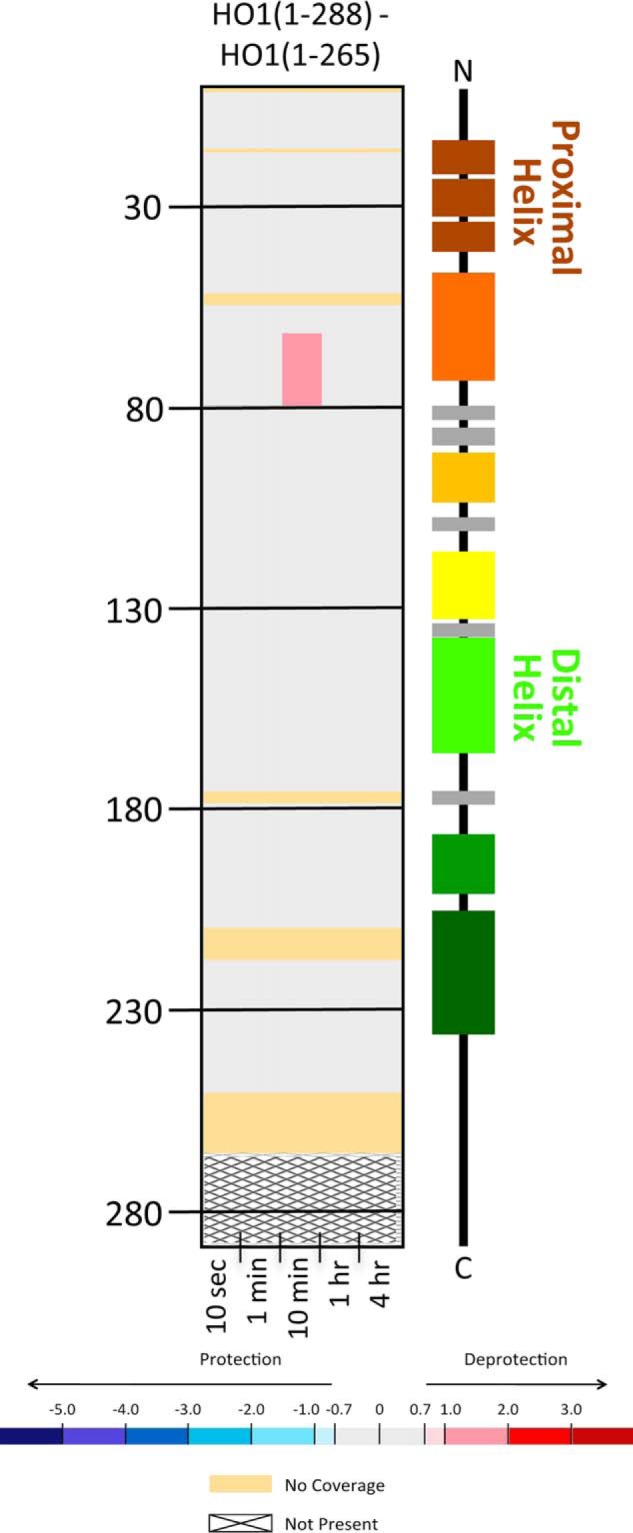
Figure 5.

HDX-MS comparisons of the apo states of HO1 constructs with two lengths of C terminus. Deuterium differences were calculated from Dapo HO1(1–288) − Dapo HO2(1–265) and colored according to the scale shown. All data used to create this figure can be found in Excel File S1.
