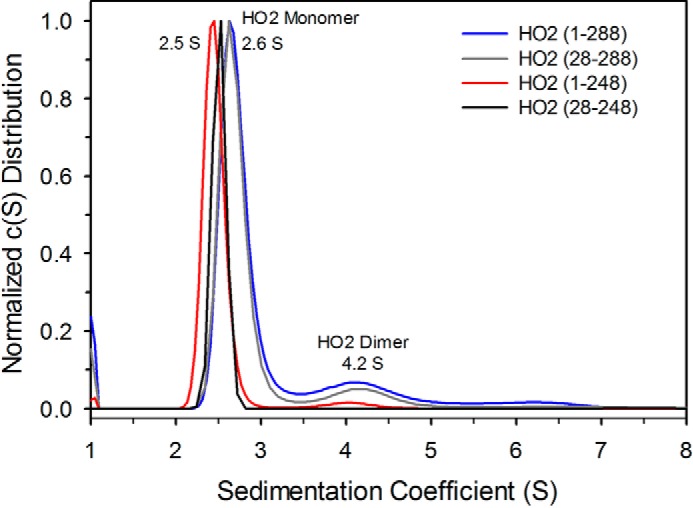
Figure 7.

Sedimentation velocity analysis of HO2 proteins. Sedimentation coefficient distributions for HO2(1–288) (blue trace), HO2(28–288) (gray trace), HO2(1–248) (red trace), and HO2(28–248) (black trace) are shown. All the proteins show a major peak corresponding to a monomer (2.5S and 2.6S), whereas a minor peak (4.2S), assigned as a dimer, is observed only for HO2(1–288) and HO2(28–288).
