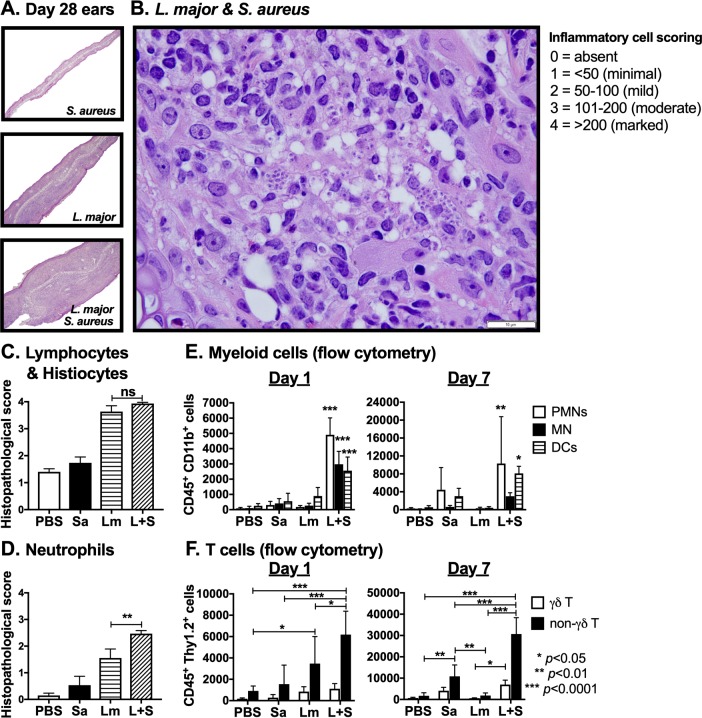
Fig 2. L. major-S. aureus coinfection results in greater neutrophil infiltration than L. major alone.
(A) Low-powered image (100x) of paraffin-embedded hematoxylin and eosin-stained sections of ears from mice intradermally injected with S. aureus (Sa), L. major (Lm), or co-inoculated with both (L+S) 28 days p.i. (B) High-powered image (1000x) of histological section from coinfected ear. White bar represents 10 μm. (C) Histological inflammatory cell scores for lymphocytes and histiocytes or (D) neutrophils from ears 28 days p.i. were calculated as the average score of four high-powered (400x) fields per ear. (E) Numbers of neutrophils (PMNs) (CD45+ CD11b+ Ly6Ghi Ly6Cint), inflammatory monocytes (MN) (CD45+ CD11b+ Ly6G- Ly6Chi), and myeloid dendritic cells (DC) (CD45+ CD11b+ CD11c+), shown as absolute cell numbers in samples derived from inoculated ears at days 1 and 7 p.i. was determined by flow cytometry. (F) Numbers of γδ (CD45+ Thy1.2+ γδ TCR+) and non-γδ (CD45+ Thy1.2+ γδ TCR-) T cell numbers from the ears at days 1 and 7 p.i. was determined by analyzing single cells suspensions from whole ear samples by flow cytometry. Data are shown as the mean ± SEM of three separate experiments, each with 4–5 mice/group (A, B, C, and D), or as the mean ± SD of 5 mice/group in one of three representative experiments (E and F). *p < 0.05, **p < 0.01, ***p < 0.0001, ns = not significant by one-way ANOVA (C and D) or two-way ANOVA (E and F) with Tukey post-test for multiple comparisons.

