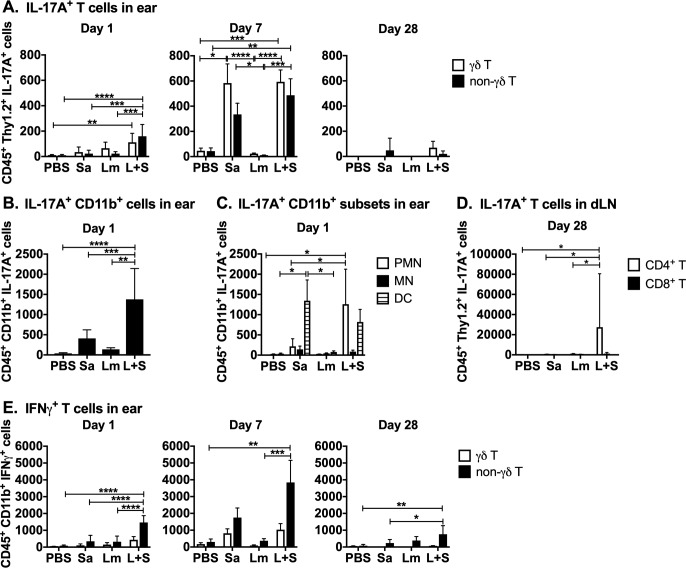
Fig 5. L. major and S. aureus coinfection results in elevated levels of immune cells producing proinflammatory cytokines.
Ears and draining lymph nodes of mice were homogenized, cultured for 4–5 hours with BFA, PMA, and ionomycin, and stained for surface markers, intracellular IL-17A or IFNγ, and analyzed by flow cytometry. Stained cells were gated on surface markers followed by intracellular cytokines. (A) IL-17A+ γδ (CD45+ Thy1.2+ γδ TCR+) and non-γδ (CD45+ Thy1.2+ γδ TCR-) T cell numbers from the ears at days 1, 7, and 28 p.i. (B) Numbers of IL-17A+ cells co-staining with CD11b from ears 1 day p.i. (C) Numbers of IL-17A+ cells co-staining CD45+ CD11b+ Ly6Ghi Ly6Cint (PMN), CD45+ CD11b+ Ly6G- Ly6Chi (MN), or CD45+ CD11b+ CD11c+ (DC) from the ears at 1 day p.i. (D) Numbers of IL-17A+ CD4 (CD11b- Thy1.2+ CD4+ CD8-) and CD8 (CD11b- Thy1.2+ CD4- CD8+) T cells from draining lymph nodes at day 28 p.i. (E) Numbers of IFNγ+ γδ (CD11b- Thy1.2+ γδ TCR+) and non-γδ (CD11b- Thy1.2+ γδ TCR-) T cells from the ears at days 1, 7, and 28 p.i. Data at day 7 and CD11b+ cell data (panels A, B, C, & E) are shown as the mean ± SEM of two pooled experiments, each with 3–6 mice/group. T cell data at day 1 and 28 (panels A, D, & E) are representative of one experiment and shown as the mean ± SD of 5 mice/group. *p < 0.05, **p < 0.01, ***p < 0.001, ****p < 0.0001 by one-way ANOVA (B) or two-way ANOVA (A, C, D, and E) with Tukey’s post-test. PBS = phosphate buffered saline, Sa = S. aureus, Lm = L. major, L+S = L. major + S. aureus.

