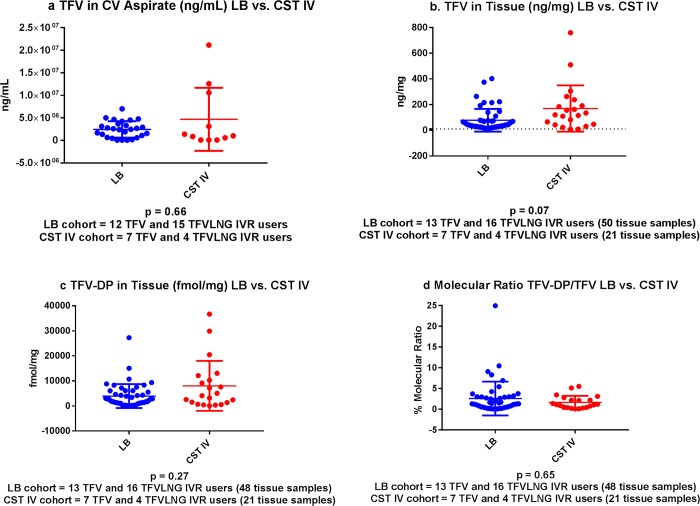
Fig 4.
A. TFV concentrations in the CV aspirate among active IVR users with Lactobacillus dominated (LB) CSTs versus CST IV. LB cohort (blue dots) includes 12 TFV and 15 TFV/LNG IVR users. CST IV cohort (red dots) includes 7 TFV and 4 TFV/LNG IVR users. B. TFV concentrations in vaginal tissue among active IVR users with Lactobacillus dominated CSTs (LB) versus CST IV. LB cohorts (blue dots) includes 13 TFV and 16 TFV/LNG IVR users contributing 50 tissue samples. CST IV cohort (red dots) includes 7 TFV and 4 TFV/LNG IVR users contributing 21 tissue samples. C. TFV-DP concentrations in vaginal tissue among active IVR users with Lactobacillus dominated CSTs (LB) versus CST IV. LB cohort (blue dots) includes 13 TFV IVR and 16 TFV/LNG IVR users contributing 48 tissue samples. CST IV cohort (red dots) includes 7 TFV IVR and 4 TFV/LNG IVR users, contributing 21 tissue samples. D. Molecular ratio of TFV-DP to TFV in vaginal tissue among active IVR users with Lactobacillus dominated CSTs (LB) versus CST IV. LB cohort (blue dots) included 13 TFV IVR and 16 TFV/LNG IVR users and contributed 48 vaginal tissue samples. CST IV cohort (red dots) included 7 TFV IVR and 4 TFV/LNG IVR users contributing 21 vaginal tissue samples.

