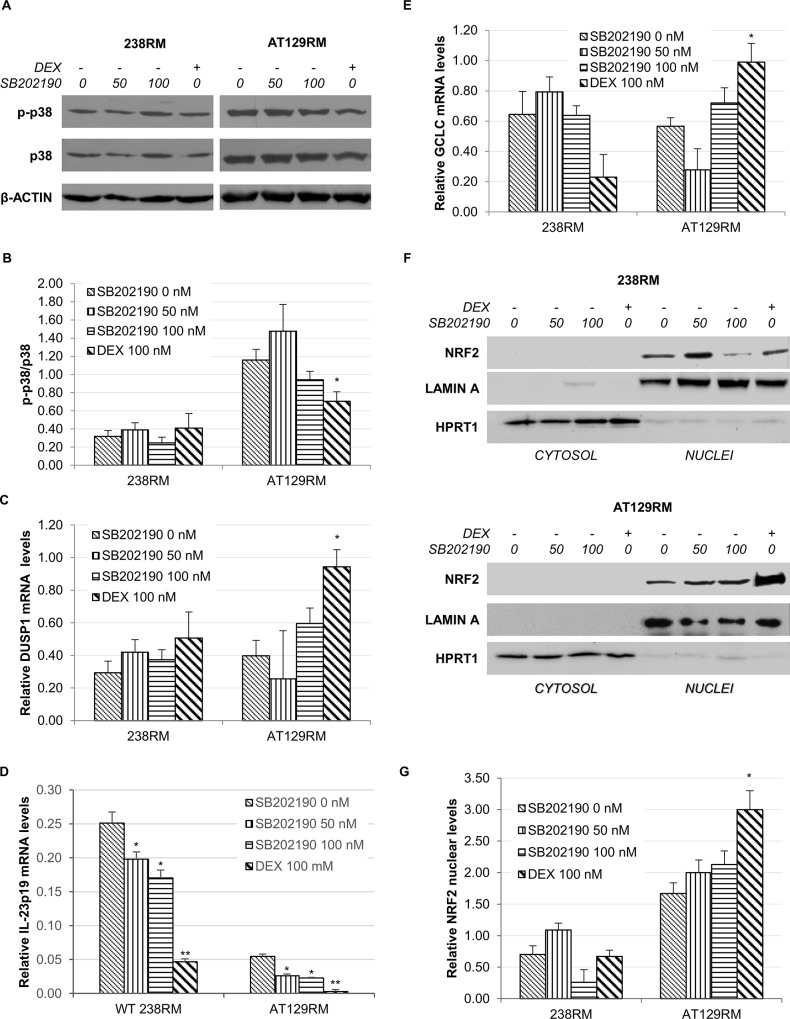
Fig 6. P38 inhibitor versus DEX effects on NRF2 activation.
A) Western blot analysis for phosphorylated p38 and total p38 in WT (238RM) and AT (AT129RM) cells treated with increasing amounts of the p38 inhibitor SB202190 (0-50-100 nM) compared to DEX (100 nM). β-ACTIN served as a loading control. B) Quantification of p-p38/total p38 ratio. C) The histogram shows the relative DUSP1 mRNA level in WT and AT samples treated as in A. D) Relative IL-23p19 mRNA levels in WT (238RM) and AT (AT129RM) cells treated as in A. B2M mRNA was used as normalizer. E) GCLC (a selected NRF2 target gene) mRNA level in WT and AT129RM cells after both SB202190 and DEX treatment, as indicated. F) Western blot analysis for NRF2 in the cytosolic/nuclear fractions of WT and AT129RM cells treated as in A. HPRT1 and LAMIN A served as a loading control for the cytosolic/nuclear extracts, respectively. G) Quantification of the relative amount of NRF2 in the nuclei of WT and AT129RM cells treated as in A. Blots shown are representative and the values are the means and SEM of four independent experiments (Wilcoxon signed rand test; *two-tailed p-values<0.05 refers to DEX vs the respective control cell line at 0 nM SB202190).

