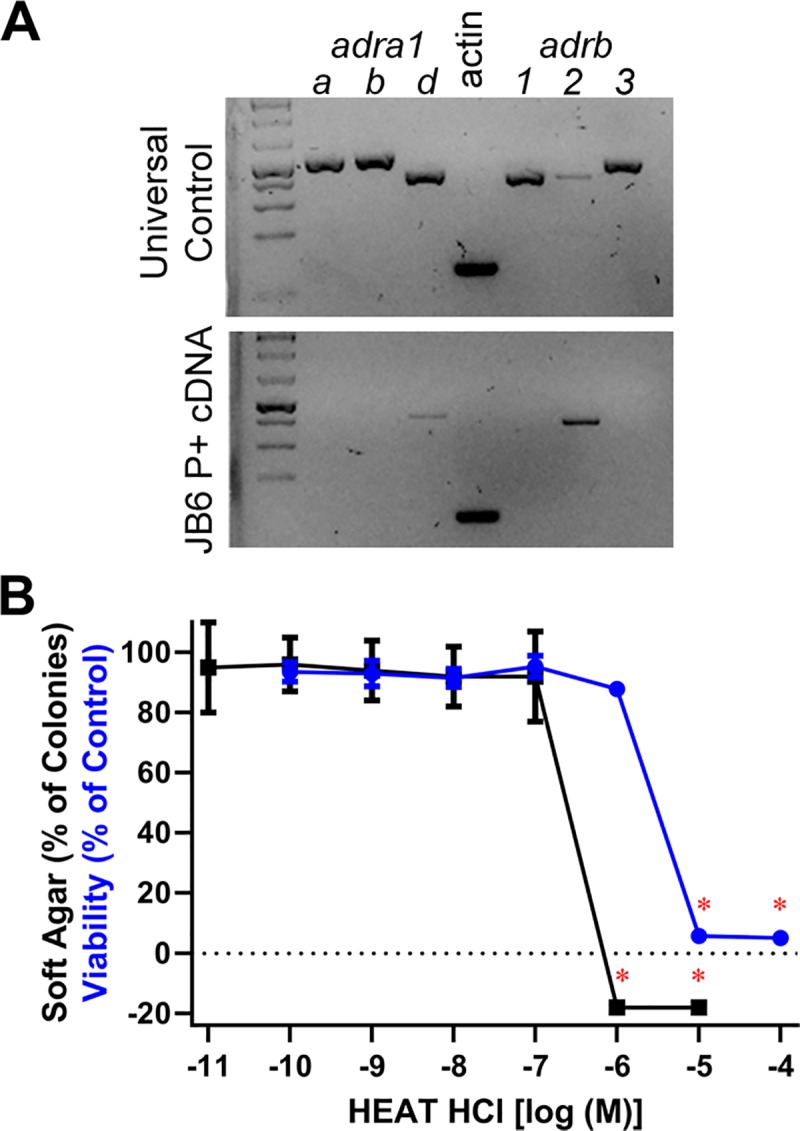
Fig 4. Expression of α1-ARs and role of α1-ARs in EGF-induced neoplastic transformation of JB6 P+ cells.

(A) Universal mouse (positive control) and JB6 P+ cDNA was amplified with primers specific for each α1- and β-AR. Only α1D-AR and β2-AR are expressed in JB6 P+ cells. (B) 10 ng/mL EGF-mediated JB6 P+ cell colony formation in soft agar (black) n = 8 and 72-hour SRB cell viability assay (blue) n = 6. Data represented as mean ± SD after normalization to control (EGF minus DMSO control for soft agar, and DMSO for SRB and MTS). A red asterisk (*) indicate that the HEAT HCl data are statistically lower than control (p < 0.05 as per an ANOVA with Tukey-Kramer post hoc test), which is not shown for the colony formation assay, indicating toxicity.
