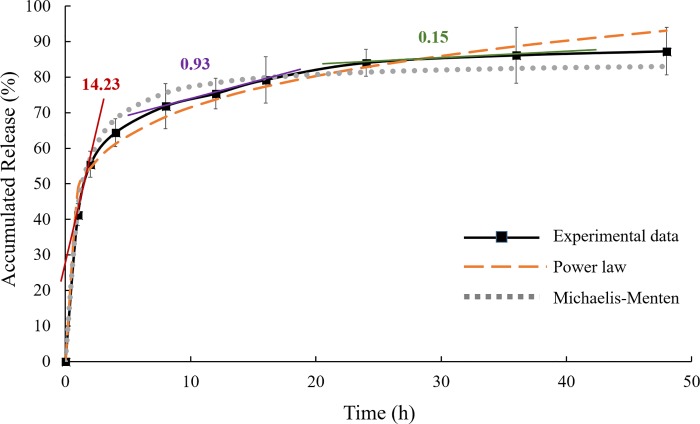
Fig 5. Astaxanthin release profile from mPEG-PCL micelles.
Astaxanthin release profile from mPEG-PCL polymeric micelles in PBS at 25°C (mean ± standard deviation, n = 3). Plots generated from the power law and the Michaelis-Menten models were compared with the experimental data. Slopes were indicated on the in vitro release profile at different stages.

