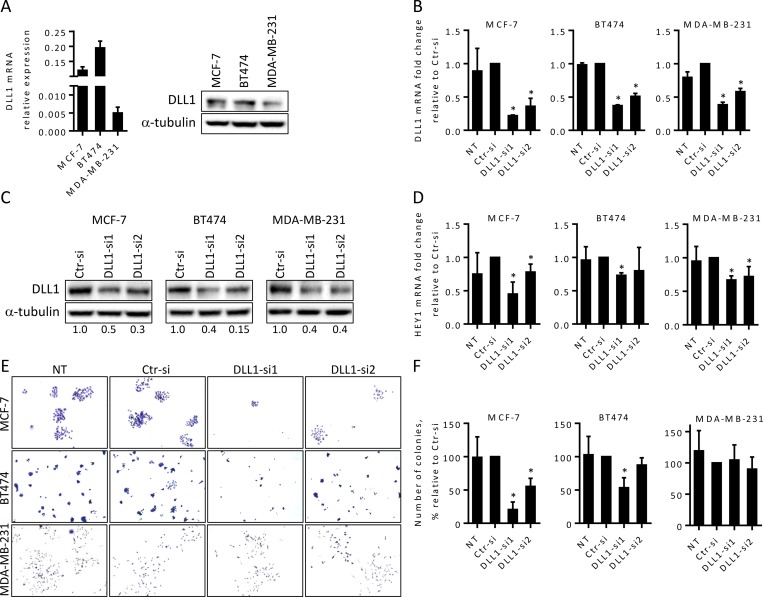
Fig 1. DLL1 downregulation impairs Notch pathway activation in BC cells and decreases MCF-7 and BT474 colony formation abilities.
(A) Expression of DLL1 mRNA and protein levels in luminal A MCF-7, luminal B BT474, and triple-negative MDA-MB-231 cells were quantitated by qRT-PCR and immunoblotting. The DLL1 mRNA values were normalized against the HPRT1 mRNA levels in the same samples. α-tubulin was used as the loading control. (B-F) Cells were transiently transfected with DLL1 siRNAs (DLL1-si1/2), negative control siRNA (Ctr-si) or not-transfected (NT). (B) Total RNA was extracted from the indicated cells 24–38 hours post-transfection and DLL1 mRNA levels were quantitated by qRT-PCR. (C) Total soluble protein extracts were prepared from cells 72 hours following transfection and the levels of DLL1 protein were assessed by immunoblotting. The numbers under the bands indicate DLL1 fold changes relative to Ctr-siRNA transfected cells after normalization against α-tubulin. (D) qRT-PCR analysis of HEY1 mRNA in the indicated cells at 48–72 hours after transfection. The values in (B) and (D) were normalized against the HPRT1 mRNA levels in the same sample and calculated as mean fold change (+ SD) relative to the respective control cells transfected with Ctr-siRNA. Graphs in (A, B and D) represents mean (+ SD) of at least three independent assays. (E-F) Colony formation of MCF-7, BT474 and MDA-MB-231 cells at day 9 post transfection. Representative fields of crystal-violet-stained colonies for each cell type of four independent assays are shown. The graphs show mean percentage of the number of colonies (+ SD) relative to the respective control cells transfected with Ctr-siRNA from these assays. *, P < 0.05, compared with Ctr-siRNA transfected cells at the respective experimental condition.

