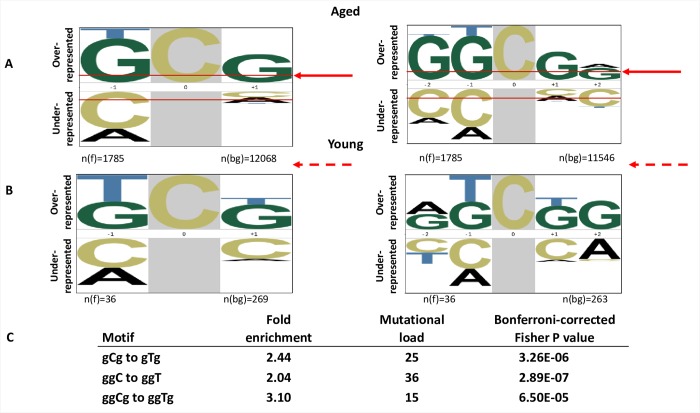
Fig 8. Signature of aging in human mtDNA.
A. Overrepresented nucleotides in tri- (left) or pentanucleotide (right) motifs flanking CG to TA transitions, comprising the majority of substitutions in mtDNA in the brains of aged individuals [21] identified by pLogo analysis [40]. The height of each letter indicates the magnitude of over- or underrepresentation. The analysis was based on combined data for C to T substitutions in mitochondria of four aged individuals. The background data set is +/− 20 nucleotides adjacent to the mutation site. The enrichment for the nucleotides above the red arrows is statistically significant, P < 0.05. B. pLogo analysis of CG to TA substitutions in mtDNA in the brains of young individuals. The foreground n(fg) = 36 is the number of all C to T substitutions in the analyzed mitochondrial sequences. The background data set is +/− 20 nucleotides adjacent to the mutation site. Dashed red arrows above the sequence indicate that none of the adjacent nucleotides are significantly enriched. C. Fold enrichment for specific motifs calculated independently by in-house pipeline (Materials and methods and [13]). The mutated residue and resulting change are capitalized. mtDNA, mitochondrial DNA.

