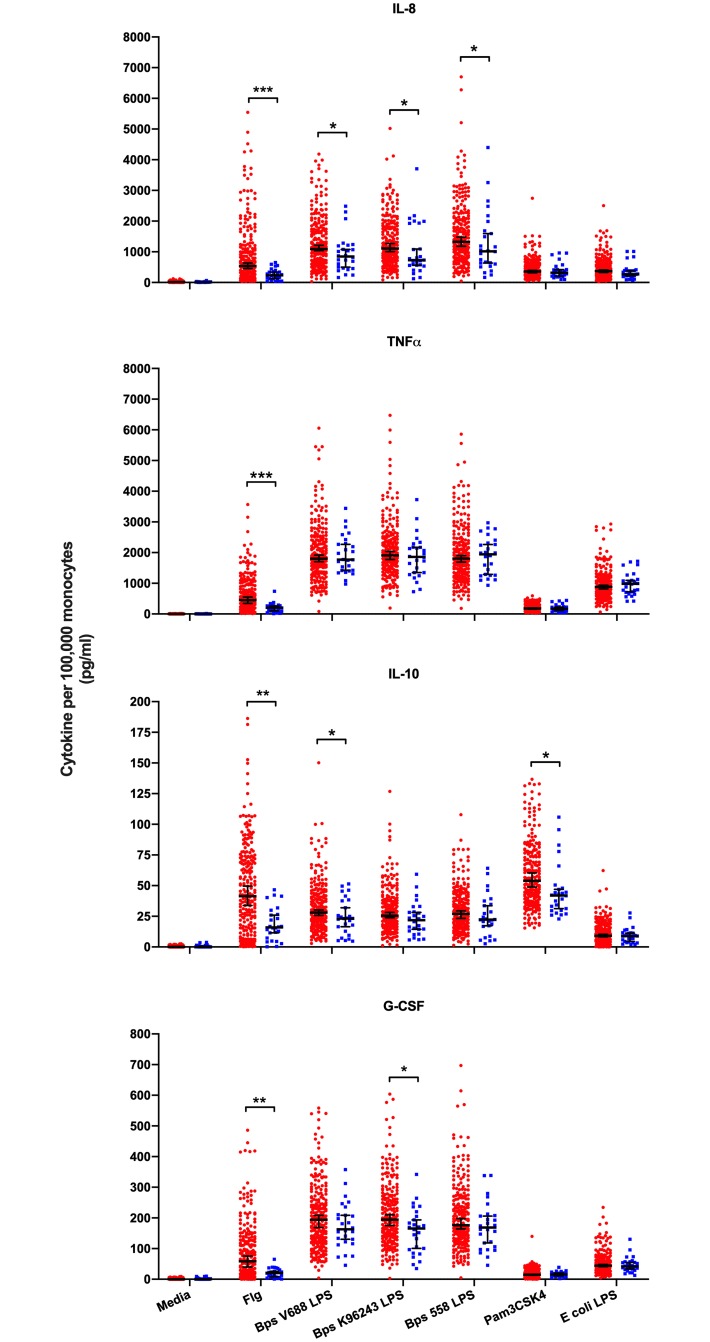
Fig 3. Blood cytokine responses to TLR agonists by TLR5:c.1174C>T genotype.
Whole blood from healthy Thai subjects was stimulated with media alone, S. Typhimurium flagellin 500 ng/ml, B. pseudomallei V688 LPS 10 ng/ml, B. pseudomallei K96243 LPS 10 ng/ml, B. pseudomallei 558 LPS 10 ng/ml, Pam3CSK4 100 ng/ml or E. coli LPS 10ng/ml for 6 hours. IL-8, TNF-α, IL-10 and G-CSF were measured in plasma by multiplex bead assay and normalized to monocyte count. TLR5:c.1174C>T genotype (CC, CT, or TT) was determined for each individual by genotyping whole blood DNA. Red dots represent CC (N = 236) and blue dots represent CT or TT (N = 26) genotypes. Superimposed lines represent the median values plus 95% confidence intervals. Statistical analysis was performed by linear regression of log10 transformed cytokines assuming a dominant genetic model, adjusting for age, sex and batch. *, P<0.05; **, P≤0.01; ***, P≤0.001. These results are also reported in S1 Table. The media, flagellin, and E. coli LPS control data have been previously published [5].

