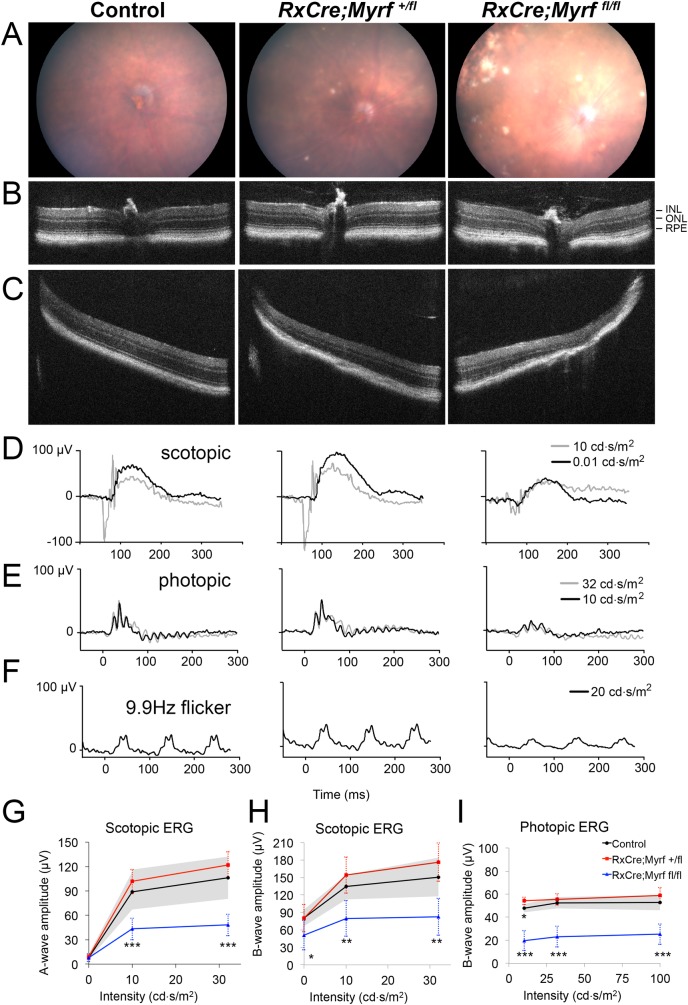
Fig 7. Loss of MYRF leads to global retinal dysfunction and patchy outer retinal atrophy.
(A-C) Representative central color fundus photos (A) and central (B) and peripheral (C) SD-OCT from 10-month old eyes from control (Myrffl/fl or Myrf+/fl), RxCre;Myrf+/fl and RxCre;Myrffl/fl mice. Patchy areas of atrophy with RPE pigment changes are seen most prominently in RxCre; Myrf fl/fl eyes (A), and correspond to outer retinal and RPE loss on OCT (C) with relatively preserved peripapillary retina (B). (D-I) Electroretinography of 10-month old control (Myrffl/fl or Myrf+/fl), RxCre;Myrf+/fl and RxCre;Myrffl/fl mice. (D-F) Representative electroretinogram traces from 10-month old mice under scotopic (D), photopic (E), or photopic 9.9 Hz flicker conditions with the noted intensity stimuli. Both scotopic and photopic responses are diminished in RxCre;Myrffl/fl eyes compared to controls. (G-I) Scotopic a-wave (G), scotopic B-wave, and photopic B-wave amplitudes and comparison statistics across varying intensity stimuli. Error bars indicate standard deviation and are noted by the shaded grey for the control group. Summary statistics for comparisons of RxCre;Myrf+/fl and RxCre;Myrffl/fl to control eyes are shown with stars. In RxCre;Myrffl/fl, scotopic a-wave ERG amplitudes are reduced by 45–50% and B-wave amplitudes are reduced 35–45%, while photopic B-wave amplitudes are reduced 50–60%. Control n = 4 eyes from 2 animals, RxCre;Myrf+/fl n = 4 eyes from 2 animals, RxCre;Myrffl/fl n = 12 eyes from 6 animals. Mean±standard deviation. ***, p < 0.001; **, p < 0.01; * p < 0.05.

