
Fig. 5. Transition of two factors following corotating mechanism.
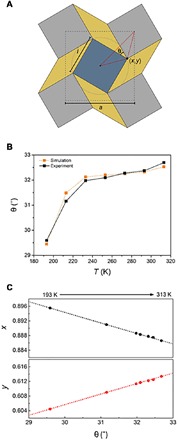
(A) Schematic representation of the relation between θ and (x, y) coordinates showing rotating squares in geometry model. (B) Comparison with θ transition of calculation and SCXRD data depending on temperature. (C) Movement of the coordinates in accordance with the change of θ. The points, x coordinate (red) and y coordinate (black), are experimental data and matched well with the calculated dotted lines.