
Figure 2.
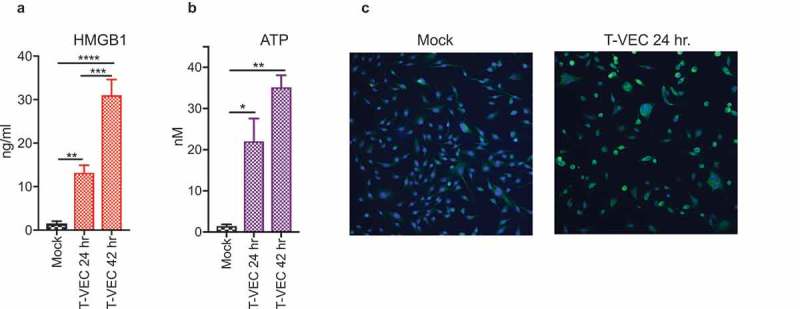
T-VEC induces immunogenic cell death and release of DAMPs. (A–B) SK-MEL-28 cells (5 × 10⁵) were mock infected or treated with 1 MOI T-VEC and cell supernatants collected at 24 and 48 h post infection. (A) Bar graph indicating levels of high mobility group box 1 (HMGB1) in cell supernatants at indicated times. (B) Bar graph indicating the level of adenosine triphosphate (ATP) in cell supernatants at indicated times. (C) SK-MEL-28 cells (1 × 10⁵) were plated in a 6-well chamber slide and treated the next day with phosphate buffer saline (mock; left panel) or 1 MOI of T-VEC (right panel) and stained with anti-calreticulin (CALR) antibody (green) and nuclear stain (DAPI; blue) 24 h post-T-VEC treatment. Each experiment was performed two times with similar results. Data are presented as mean ± SEM, and statistical differences between groups were measured by student’s t-test. *p < 0.05, **p < 0.01, ***p < 0.001, ****p < 0.0001.