
Figure 6.
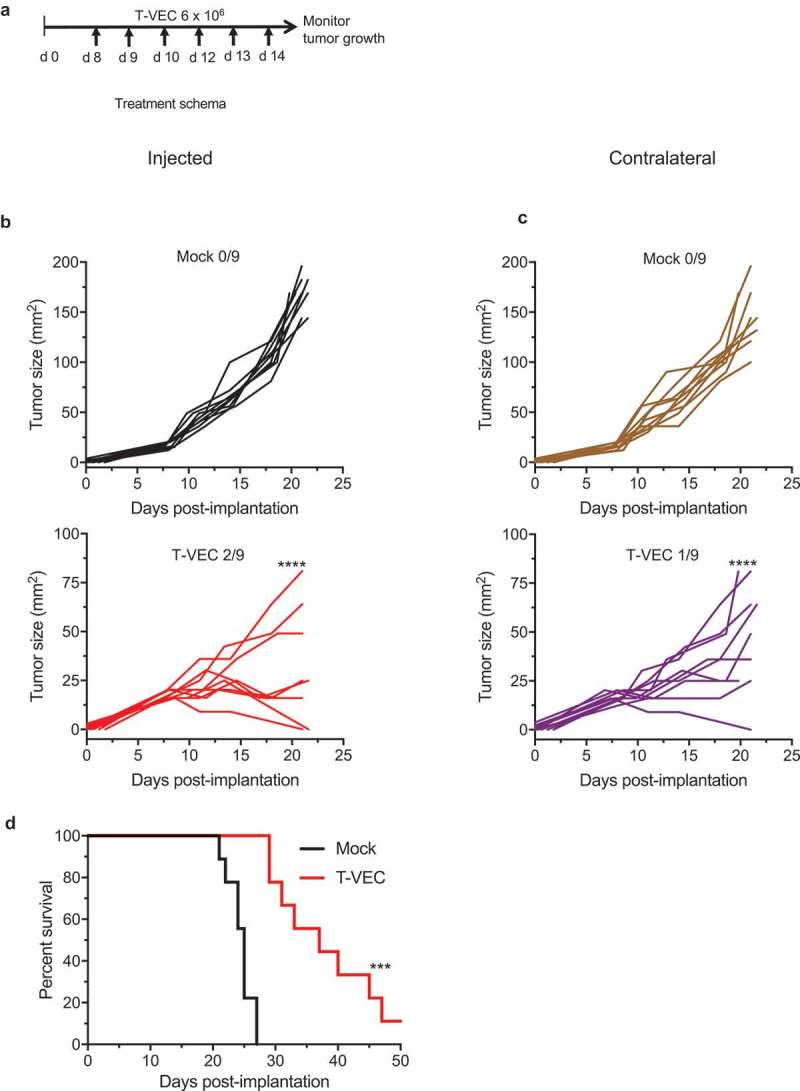
T-VEC has therapeutic activity in STING^lo melanoma in vivo. (A) Schema of treatment studies in vivo. (B) Individual tumor growth curves of injected tumors of mice treated with mock (top panel; black curves) or T-VEC (bottom panel; red curves). (C) Individual tumor growth curves of contralateral tumors of mock-treated (top panel; brown curves) or T-VEC treated mice (bottom panel; purple curves). Mean tumor area of Mock injected (169.4 mm2) was compared to mean tumor area of Mock un-injected (144 mm2), mean tumor area of T-VEC-injected (15.33 mm2) and mean tumor area of T-VEC-un-injected (47 mm2) at day 21 (D) Kaplan-Meier survival curves from animals. Each experiment was performed twice with similar results. Statistical differences between groups were compared on day 21 by student’s t-test and for survival was performed by Log Rank test. ***p < 0.001, ****p < 0.0001.