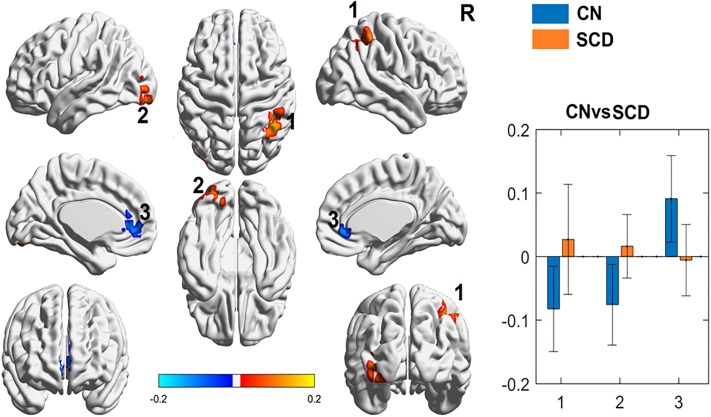
Fig 1. Periaqueductal gray (PAG) seed-based functional connectivity (FC) analyses between patients with SCD (SCD) and controls (CN).
Left: Images show the results of the two sample t-test pattern of CN (controls, blue) and SCD (patients with sickle cell disease, orange) PAG FC, respectively. Color is coded based on z-score of the significance. Brain regions with warm color represent the positive connection and cold color represents the autocorrelation with PAG regions. Brain regions are numbered: (1) right inferior and superior parietal lobule, (2) left inferior occipital gyrus (Brodmann area 17 and 18), and (3) left and right anterior cingulate. Right: In comparison to CN (blue), SCD (orange) demonstrated increased connectivity in (1) right inferior and superior parietal lobule, (2) left inferior occipital gyrus (Brodmann area 17 and 18), and decreased connectivity in the (3) left and right anterior cingulate (y-axis = z-score of the significance, x-axis = brain region of interest by number).

