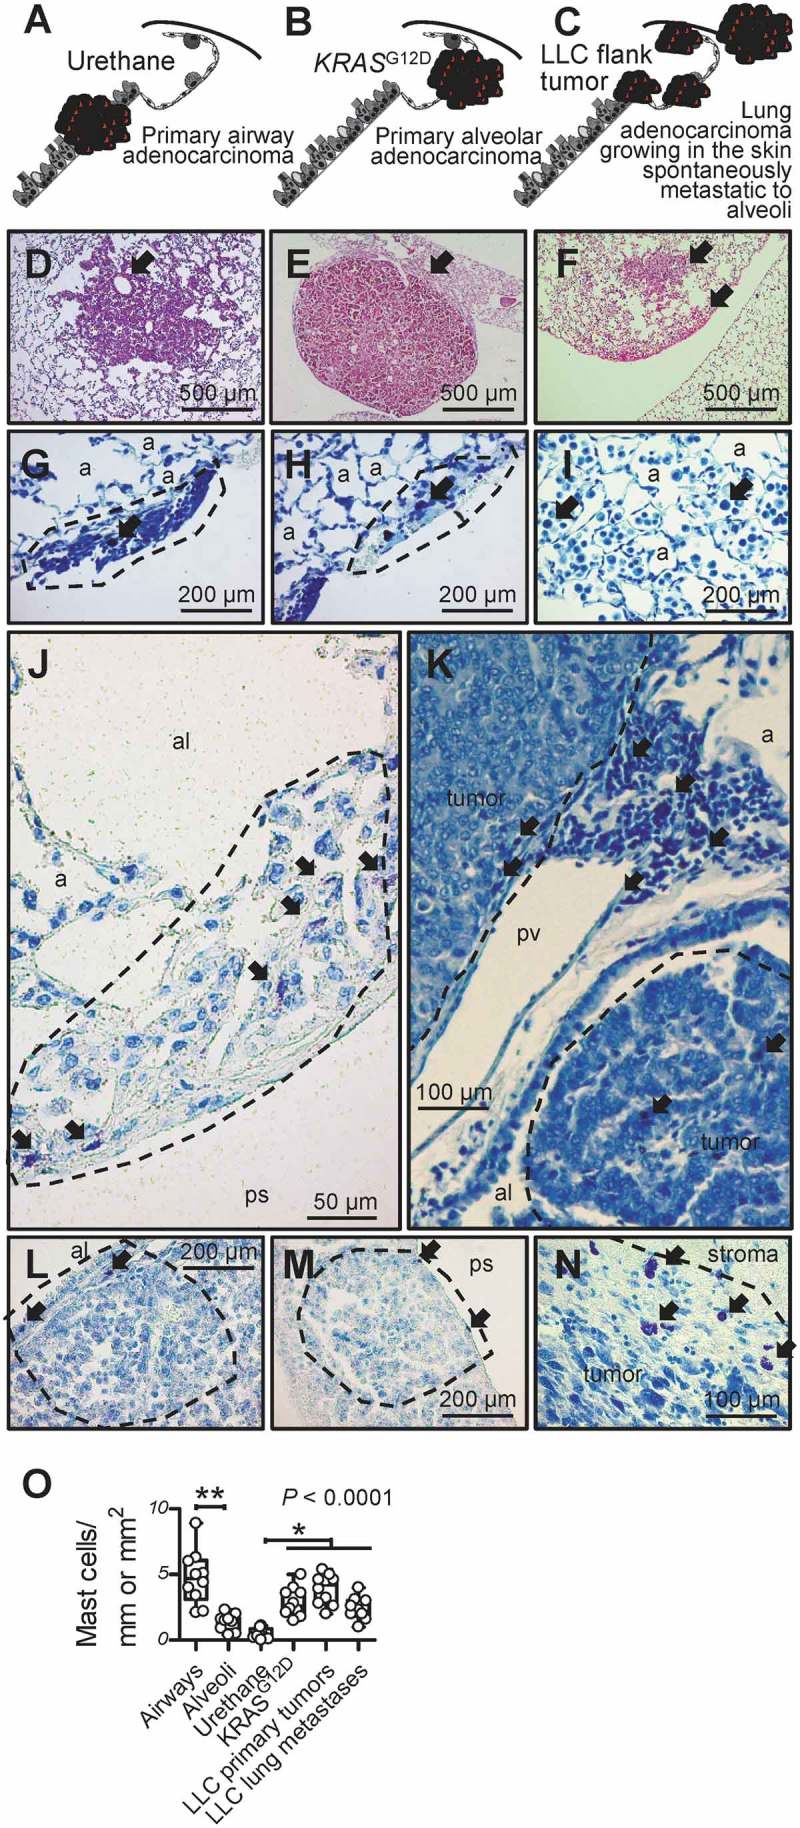
Figure 1.

Mast cells in murine lung adenocarcinomas.
A-F Schematics depicting tumors (red) of the airways, alveoli, and skin (A-C) and representative microscopic images of hematoxylin/eosin-stained sections (D-F) of airway-originated lung adenocarcinomas (LADC) induced in C57BL/6 mice by 10 weekly consecutive intraperitoneal injections of 1 g/Kg urethane (six months latency; A and D; arrow in D denotes originating bronchus), of alveolar-derived LADC induced in KRASG12D-transgenic mice by intratracheal injection of 5 × 10⁸ pfu Ad-Cre (four months latency; B and E; arrow in E denotes originating alveolar region), and of skin heterotopic LADC spontaneously metastasizing to the alveolar regions induced by subcutaneous delivery of 106 LLC cells (one month latency; C and F; arrows in F denote alveolar regions involved by metastases). G-N Toluidine blue-stained lung and tumor sections from the above-described three mouse models of LADC showing metachromatic (purple) mast cells (arrows) in early urethane-induced atypical alveolar hyperplasias (dashed lines in G and H), in tumor-adjacent alveolar inflammatory infiltrates (I), in and adjacent to urethane-induced LADC (dashed lines in J and K), entering alveolar KRASG12D-transgenic tumors from the airway lumen and the pleural space (dashed lines, L and M), and in subcutaneous LLC tumor (dashed line in N). a, alveoli; al, airway lumen; ps, pleural space; pv, pulmonary vein. O Mast cell abundance of urethane- and KRASG12D-primary tumors and LLC primary tumors and metastases compared with airways and alveoli of naïve C57BL/6 mice (n = 10/group). Data are presented as median with Tukey’s whiskers (boxes: interquartile range; bars: 50% extreme quartiles), raw data points (dots),and Kruskal–Wallis analysis of variance (ANOVA) probability (P) value.* and **: P< 0.05 and P< 0.01, respectively, for the indicated comparisons by Dunn’s post-tests. Only statistically significant differences are indicated.
