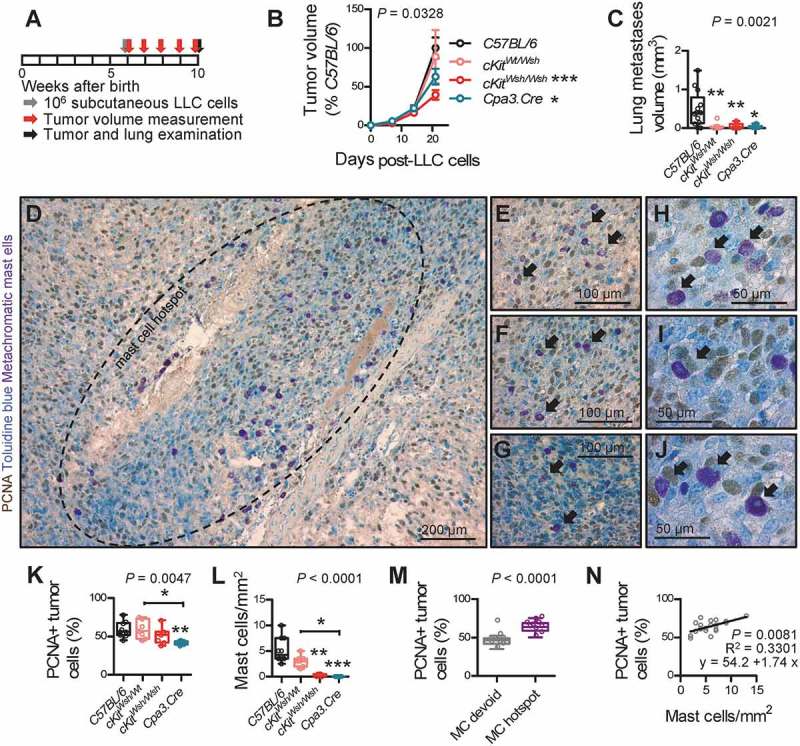
Figure 5.

Mast cell deficiency protects mice from Lewis lung adenocarcinoma growth in the skin and its metastasis to the alveolar regions.
C57BL/6 controls (cKitWt/Wt and Cpa3.Cre−/- littermate controls, as well as Lyz2.Cre mice), cKitWsh/Wt, cKitWsh/Wsh, and Cpa3.Cre mice, all on the C57BL/6 background (n = 13, 7, 7, and 6, respectively), received 106 subcutaneous Lewis lung carcinoma cells (LLC), were followed for one month by weekly measurement of three vertical primary tumor diameters (δ) and calculation of primary flank tumor volume (V = πδ3/6) and were sacrificed for primary tumor and spontaneous lung metastasis analyses at one month post-LLC cells. A Schematic time-course of the experiment with boxes representing one week. B Data summary of primary subcutaneous tumor volume expressed as percentage of C57BL/6 controls (mean±SEM) with two-way ANOVA P value. * and ***: P< 0.05 and P< 0.001, respectively, for comparison with C57BL/6 controls by Bonferroni post-tests. C Data summary of absolute lung metastasis volume (burden) per lung. D-J Toluidine blue-counterstained primary LLC tumor sections of C57BL/6 control mice (n = 10) labeled for proliferating cell nuclear antigen (PCNA), a technique that allows simultaneous visualization and quantification of proliferating cells (brown), mast cells (purple), and nuclei (blue). Shown are representative mast cell hotspot (D; dashed line) and areas of such hotspots featuring mast cells in close association/contact with proliferating tumor cells (E-J; arrows). K-N Data summary of percentage of PCNA+ primary tumor cells (K), primary tumor mast cell density (L), percentage of PCNA+ cells in mast cell hotspots versus mast cell-devoid areas of primary tumors of C57BL/6 mice (M), and correlation of these two parameters in mast cell hotspots of primary tumors of C57BL/6 mice (N). (K, L) n = 10, 7, 7, and 6, respectively. (M) n = 10 C57BL/6 mice. (N) n = 2 hotspots from each of 10 C57BL/6 mice. Data information: (C, K, L, M) Data are shown as Tukey’s whiskers (boxes: interquartile range; bars: 50% extreme quartiles), raw data points (dots), and Kruskal–Wallis ANOVA (C, K, L) and Mann–Whitney u-test (M) P values. *, **, and ***: P< 0.05, P< 0.01, and P< 0.001, respectively, for comparison with C57BL/6 controls or as indicated by Dunn’s post-tests. Only statistically significant differences are indicated. (N) Shown are data points, Pearson correlation P value and coefficient, and linear regression line and formula.
