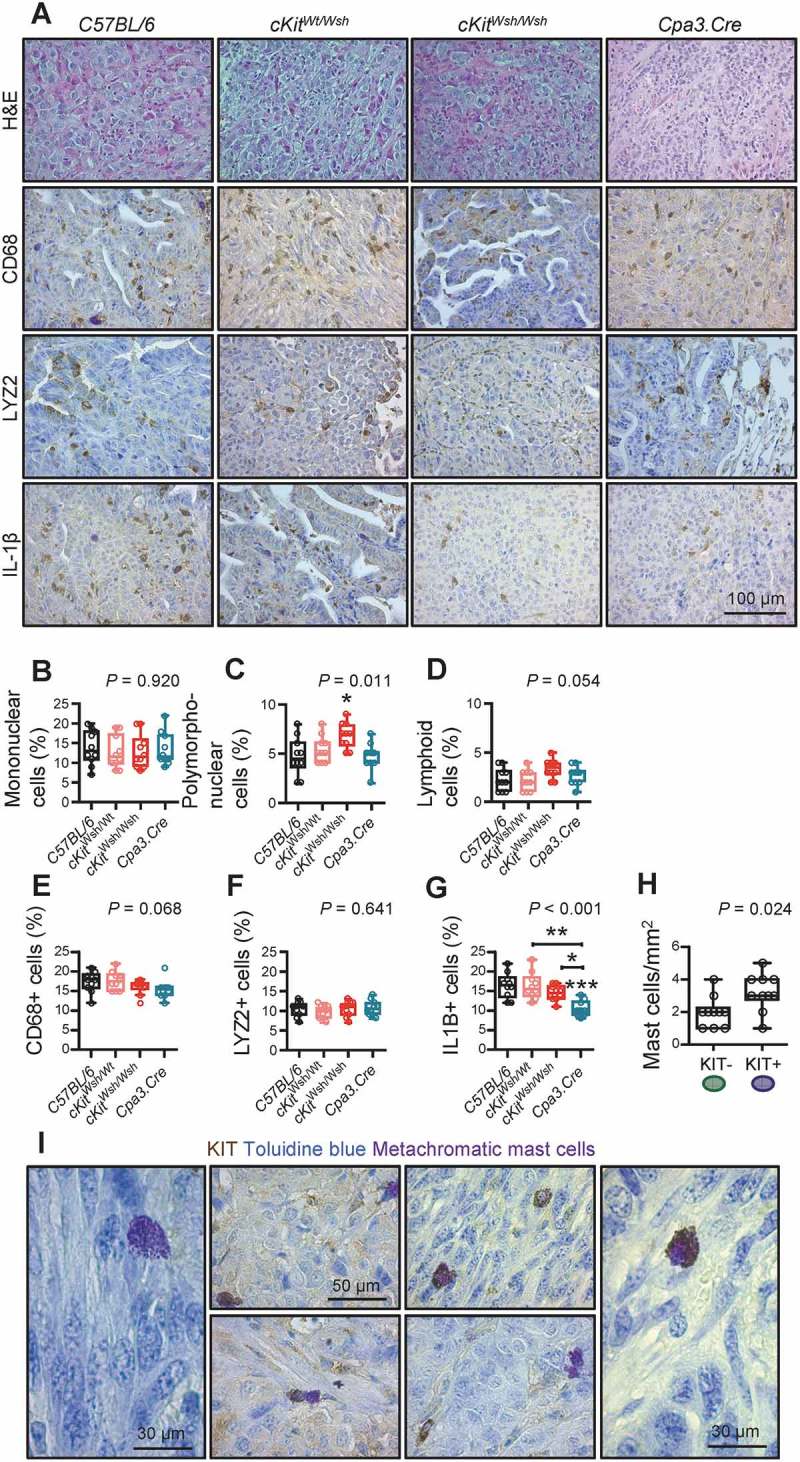
Figure 7.

Lung adenocarcinoma microenvironment of mast cell-competent and incompetent mice.
A Representative images of lung adenocarcinomas from Figures 3–5 (n = 10 mice/group randomly chosen from the urethane, KRAS,G12D and heterotopic models) stained with hematoxylin and eosin (H & E) or immunostained with anti-CD68, anti-LYZ2, and anti-IL-1β antibodies and counterstained with toluidine blue. B-G Data summary from (A). Data are shown as Tukey’s whiskers (boxes: interquartile range; bars: 50% extreme quartiles), raw data points (dots), and Kruskal–Wallis ANOVA P values. Comparisons shown are. *: P< 0.05 for comparisons with C57BL/6 controls or as indicated by Dunn’s post-tests. Only statistically significant differences are indicated. H Representative lung adenocarcinomas from Figures 3–5 (n = 10 mice/group randomly chosen from the urethane, KRAS, G12D and heterotopic models) were immunostained with anti-KIT antibody and counterstained with toluidine blue. Data summary shown as Tukey’s whiskers (boxes: interquartile range; bars: 50% extreme quartiles), raw data points (dots), and Mann–Whitney u-test P value. I Representative images of LADC-infiltrating KIT+ (left) and KIT- (right) MC and their co-localization in tumors (middle).
