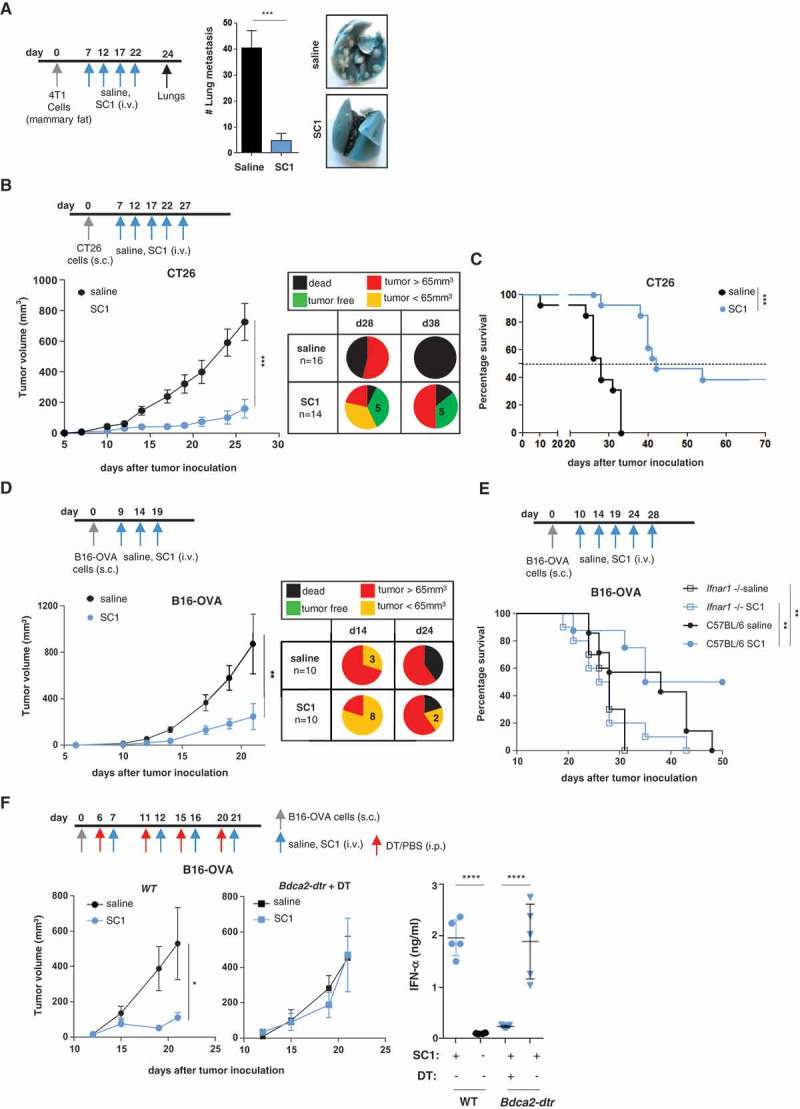
Figure 2.

SC1 treatment of mice with established tumors mediates efficient pDC- and IFNα-dependent tumor rejection and survival benefit.
BALB/c or C57BL/6 mice were injected with tumor cells. When tumors reached sizes of 20–50 mm3 mice were treated i.v. with SC1 or with vehicle (saline) every 5 d. (a) Macroscopic spontaneous lung metastasis count in BALB/c mice (n = 7 per group) on d 24 after orthotopic 4T1 cell injection. Data representative of two independent experiments. (b) Tumor growth in BALB/c mice (n = 16/group) injected s.c. with CT26 cells. Pie charts show the proportion of mice displaying the indicated tumor stage at d 28 and 38 after CT26 inoculation. Tumor-free (TF), dead mice and mice bearing different size of tumors are indicated. (c) Survival of CT26-tumor-bearing mice. Data representative of more than three independent experiments. (d) Tumor growth in C57BL/6 mice (n = 10) injected s.c. with B16-OVA cells. Pie charts show the proportion of mice displaying the indicated tumor stage at d 14 and 24 after tumor inoculation. (e) Survival of C57BL/6 and Ifnar1−/- mice (n = 7–10) injected with B16-OVA cells. (f) Tumor growth in C57BL/6 WT (n = 8, left) and Bdca2-dtr mice (n = 6, center) injected s.c. with B16-OVA cells and i.p. with DT. IFNα levels in the sera of mice 1 h after the first i.v. injection with SC1 or vehicle (saline) was measured by ELISA (right). Data shown as mean ± s.e.m.of the indicated experimental numbers, p*<0.05, p**<0.01, p***<0.001, p****<0.0001 using Mann–Whitney test (A, B, D, and F, left) or one-way ANOVA-test (F, right) or Log-rank (Mantel-Cox) test (c,e).
