FIG. 1.
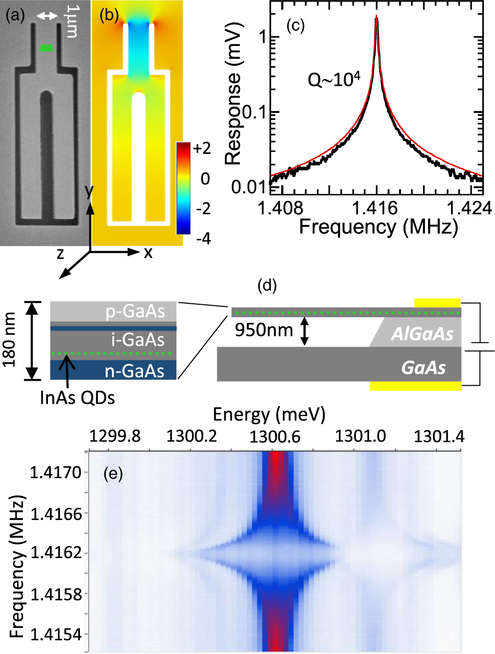
(a) Scanning electron micrograph of a tuning fork cantilever, with a green trapezoid indicating the estimated position of the QDs studied. (b) Finite element model of strain ϵyy within the cantilever at the QD depth for a displacement at the end of 160 nm. The color scale labels are in 10−4 fractional change in length. (c) Reflectivity response of a cantilever vs drive frequency, with a fit (red line) to the square root of a Lorentzian.(d) Schematic of the suspended sample structure with n-i-n-i-p diode. (e) Time-integrated PL color map as a function of emission energy and drive frequency at zero magnetic field for a negatively charged exciton.

