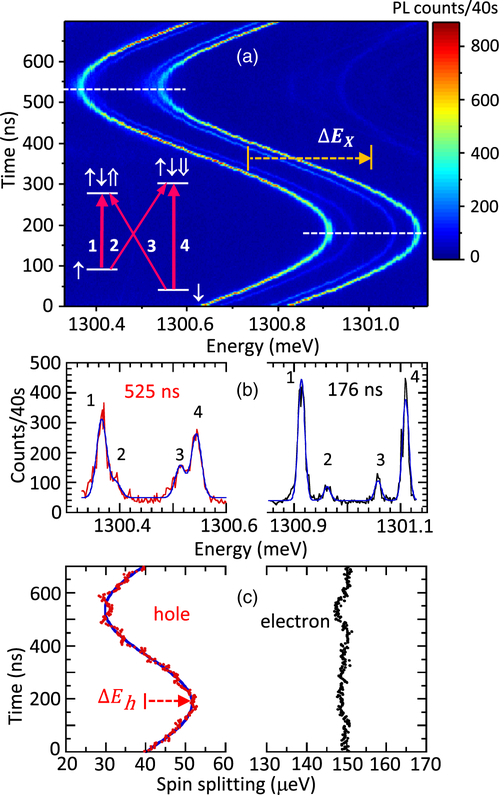
FIG. 2.
(a) Emission from X− in a 6 T Voigt magnetic field under resonant driving of the cantilever at 1.4162 MHz with 30 μW power at 923.5 nm. The emission is measured as a function of time, synchronized to the mechanical drive frequency. The inset shows a level diagram of X−, indicating the four possible transitions. The horizontal, dashed lines indicate the times of maximum and minimum energy, for which spectra are displayed in (b). (c) Hole and electron spin splittings as a function of time. The hole data are fit to a sine function (solid curve).

