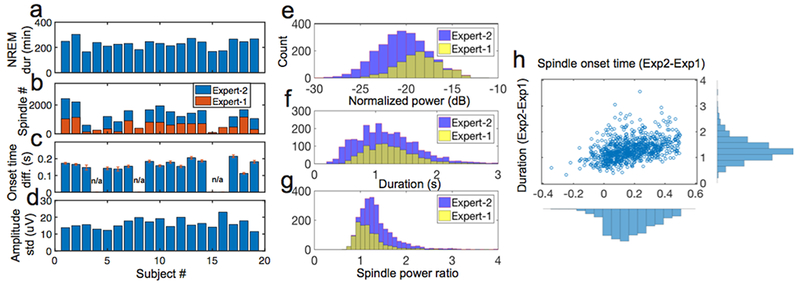
Figure 1. Statistics of MASS dataset.

a, Statistics of NREM duration (min) on 19 human subjects. b-d, Statistics of annotated spindle number (b), onset time difference between two experts (c) and amplitude standard deviation (d). In panel c, n/a represents the condition only one expert’s annotation was available; the onset time difference among 15 subjects were 0.167 ± 0.007 s (mean±SEM). e-h, In subject #1, statistics discrepancy between two experts on the commonly annotated sleep spindles’ normalized power (e), duration (f), power ratio (g) and difference between two experts (Expert 2-Expert 1) on the spindle onset and duration (h).
