
Figure 2. SpindleNet: deep neural network (DNN) architecture used for spindle detection.
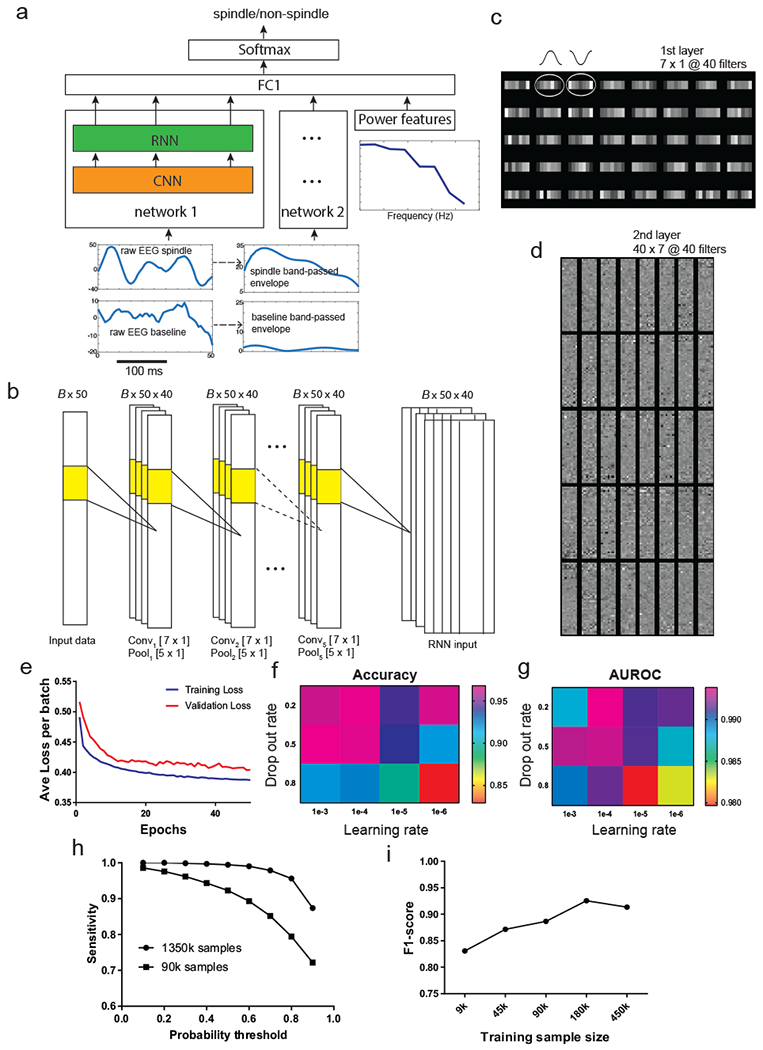
a, Overall architecture of the network. The input to subnetwork 1 and 2 consists of raw EEG signal and the envelope of bandpass filtered (9-16 Hz) EEG signal, respectively. The power features that are directly input to the fully connected layer consist of the ratio of the average power of spindle-band frequencies (9-16 Hz) to that of lower frequencies (2-8 Hz) and the instantaneous power of all frequencies from (2-16 Hz). The convolutional neural network (CNN) acts as a temporal feature extractor. The features learned by the CNN are further passed to a recurrent neural network (RNN) that is intendent to discover temporal patterns within the CNN features. The RNN implementation consists of a single-layer long short-term memory (LSTM). The output of the RNN (from 50 time steps) of subnetwork 1 is combined with the output of RNN from the subnetwork 2 and the power features using a fully connected layer. Output of this layer (of length 50) is further processed by a softmax activation function that produces a probability output (spindle vs non-spindle). b, Detailed architecture of the 5-layer CNN. The input is processed by a total of 5 layers. Every layer consists of 40 1D filters of size 7×1, followed by max-pooling with kernel size 5×1. For 250-ms EEG with 200 Hz sampling frequency, the size of input is 50. Batch size is set to B=20. c, A set of 7×1 learned receptive fields (RFs) from the first-layer CNN filters upon completion of training. The 1D filters share a resemblance to the shape of half cycle of spindle oscillation. d, A set of 40×40×7 learned RFs from the second-layer CNN filters. e, The learning convergence curve on training and validation data. f, The change of detection accuracy with respect to two learning hyperparameters: learning rate and drop-out rate. g, The change of AUROC statistic with respect to the learning rate and drop-out rate. h, The sensitivity of spindle detection improved with increasing training sample size (both tested on the same test data). i, The F1-score of detection gradually increased with increasing training sample size.