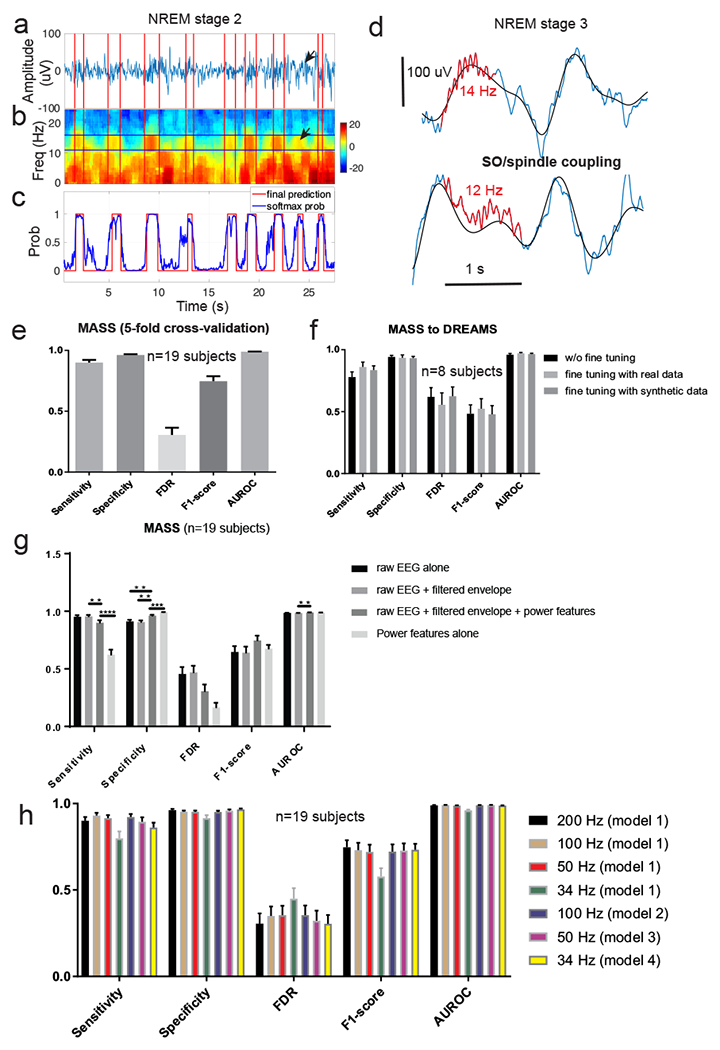
Figure 4. Results on online sleep spindle detection.

a, A representative snapshot of EEG trace (during stage-2 NREM sleep) with human marked sleep spindles (in red). b, Associated EEG multi-taper spectrogram (1 s moving window, 5 ms step size). Arrows in panels a and b denote a potentially unlabeled spindle by two experts, which was detected by SpindleNet. c, Softmax probability output (blue) and the final hard decision (red, probability threshold 0.9) for online spindle detection. d, Representative EEG traces (blue) during stage-3 NREM sleep that demonstrate coupling between slow wave (0.5-4 Hz, black trace) and spindles (marked in red). In these two examples, fast (13-16 Hz) sleep spindles tend to occur in the ascending phase of SO cycle (or be coordinated with depolarizing cortical up state), whereas slow (9-12 Hz) spindles tend to occur in the descending phase of SO cycle, or during the transition from cortical down to up states. Note that a large latency in spindle detection may switch from the up ascending phase to the down descending phase of the SO. e, Summarized results (from 5-fold cross validation) of sensitivity, specificity, false discovery rate (FDR), F1-score and AUROC statistics in the MASS dataset (n=19 subjects). Error bar represents SEM. f, Summarized results of sensitivity, specificity, FDR, F1-score and AUROC statistics in the DREAM dataset (n=8 subjects), using SpindleNet trained from the MASS dataset without further fine tuning as well as with fine-tuning using real and simulated spindles. Fine-tuning with real and simulated data further improved the performance. Error bar represents SEM. g, Performance comparison (5-fold cross-validated results) of DNN using different input features: raw EEG signal, filtered EEG envelope within the spindle frequency band (9-16 Hz), and the power feature. h, Results on spindle detection from the MASS dataset (n=19 subjects, error bar represents SEM) under various EEG sampling frequencies. Model 1: standard model trained with EEG signal with 200 Hz sampling rate; Models 2-4: models trained on down-sampled EEG signals at frequencies 100 Hz, 50 Hz, 34 Hz, respectively. In testing EEG signals with <200 Hz sampling frequency, we either up-sampled the signal and applied the standard model (Model 1), or applied the respective model for the sampling frequency. SpindleNet demonstrated robust performance across various sampling frequencies.
