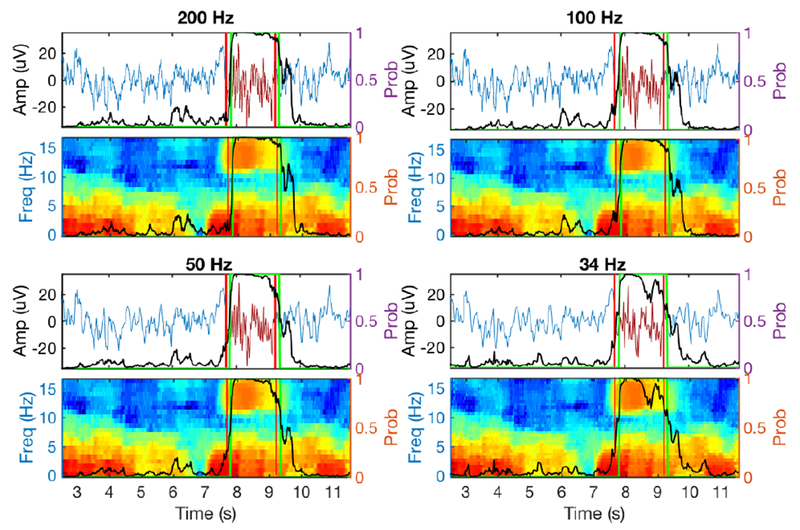
Figure 5. Illustration of EEG traces and spectrograms with annotated (between two red vertical lines) and detected (marked by green vertical lines) sleep spindles at four different sampling frequencies.

Black trace denotes the softmax probability output from SpindleNet. Despite the lower sampling rate and loss of fidelity in EEG spindles, SpindleNet detected the spindle onset reliably.
