Fig. 1.

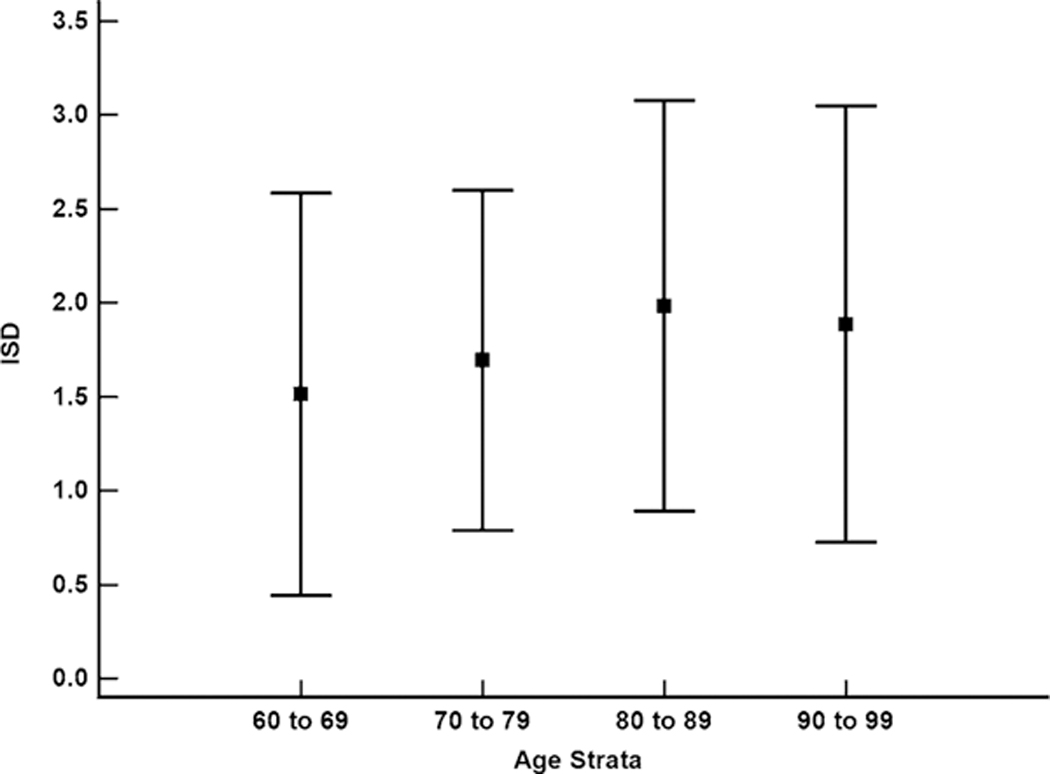
Intrasubject standard deviation (ISD) values for the MoCA by age strata. Boxes are means and error bars are standard deviation; Only the 60–69 and 80–89 age strata were significantly different (p = 0.01)

Intrasubject standard deviation (ISD) values for the MoCA by age strata. Boxes are means and error bars are standard deviation; Only the 60–69 and 80–89 age strata were significantly different (p = 0.01)