
Figure 3:
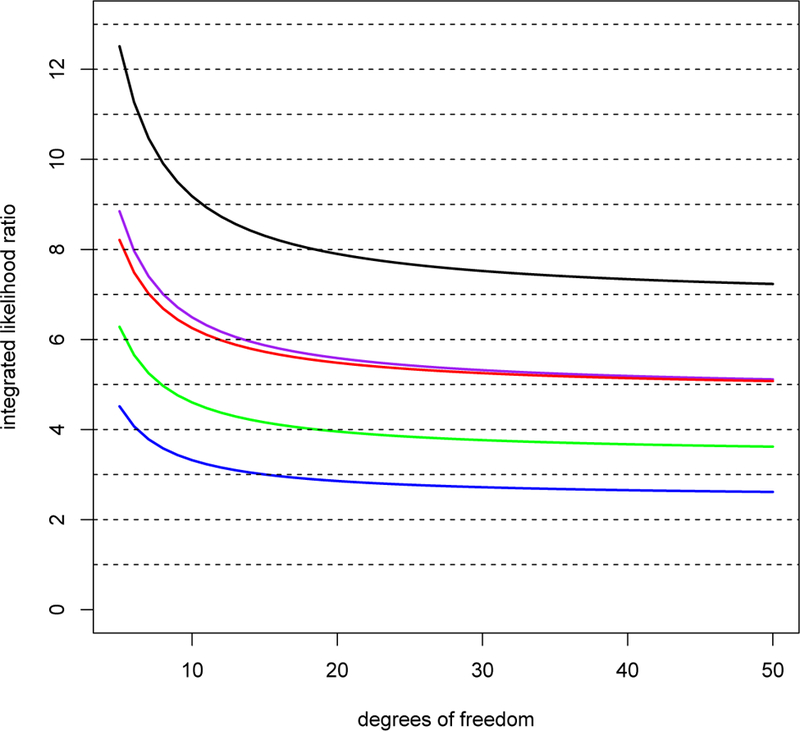
ILRs for two-sided tests. The black curve depicts the maximum ILR for a two-sided t-test yielding p = 0.05. The alternative hypothesis underlying this curve assumes that , the value of the sample mean that produces a two-sided p-value of 0.05. The green curve represents the ILR for a two-sided t-test yielding p = 0.05 obtained by setting , each with probability one-half, and g = 0. The blue curve was obtained similarly, except that g = 1/n to account for variation in the sample mean. The purple curve was obtained by taking and g = 1/n in (1). The red curve represents the “average” ILR for two-sided t-tests yielding p = 0.05. The marginal likelihood for this curve was obtained by replacing the marginal density of the data under the alternative hypothesis with its expected value at the true value of μ.