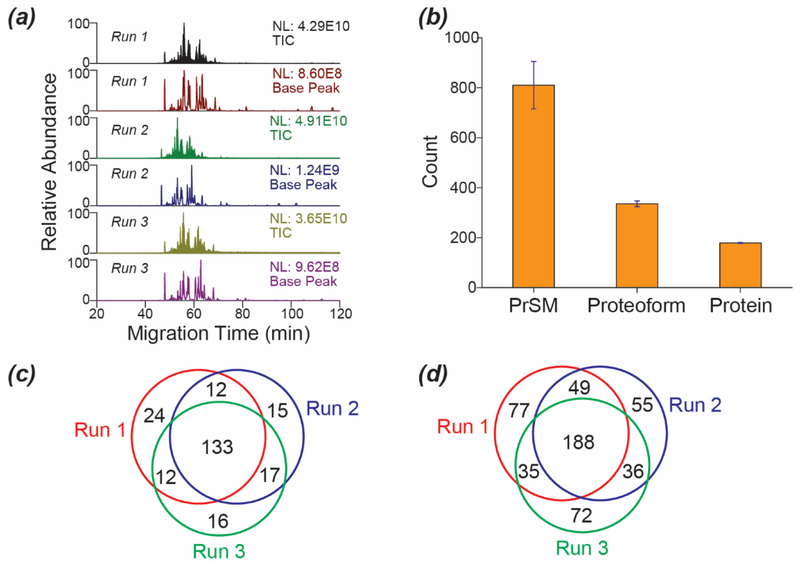
Figure 2.
Evaluation of reproducibility of the optimized CZE-AI-ETD system for top-down proteomics. (a) Base peak and total ion current (TIC) electropherograms of the E. coli sample analyzed by the optimized CZE-AI-ETD in triplicate. (b) Numbers of PrSMs, proteoforms, and proteins identified by the optimized CZE-AI-ETD. The error bars show the standard deviations of the IDs from the triplicate CZE-AI-ETD analyses. (c) The protein-level overlaps among the CZE-AI-ETD runs. (d) The proteoform-level overlaps among the CZE-AI-ETD runs.

