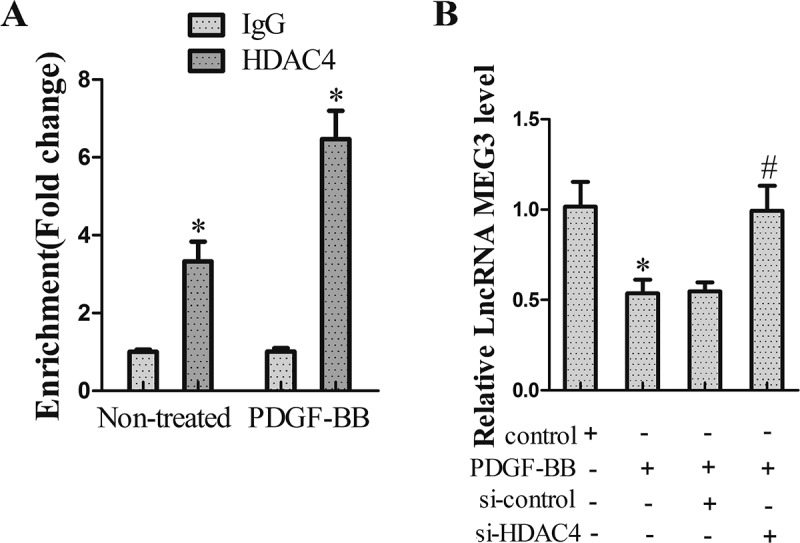
Figure 2.

The interaction between MEG3 and HDAC4. (a) The relationship between MEG3 and HDAC4 was measured using ChIP assay. *P < 0.05, vs IgG. (b) VSMCs were divided into control group, PDGF-BB group, PDGF-BB+ si-control group and PDGF-BB+ si-HDAC4 group. qRT-PCR was used to determine MEG3 expression. *P < 0.05, vs control group; #P < 0.05, vs PDGF-BB+ si-control group.
