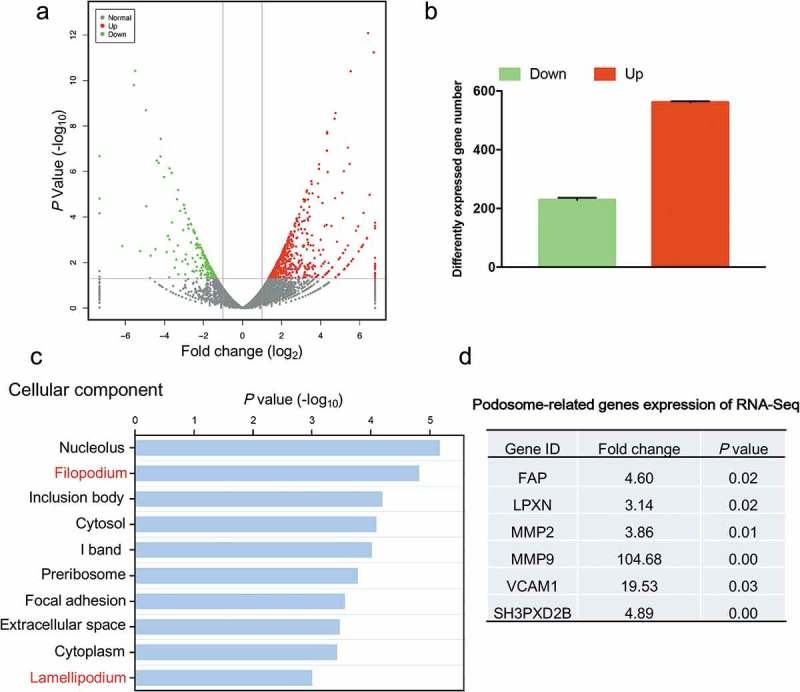
Figure 3.

Gene expression analysis of HSCs cultured on 2D PS and in 3D FCM by RNA-Seq. (a). Volcano plot of the gene expression values. Red, gene expression upregulated in HSCs cultured in 3D FCM. Green, gene expression downregulated in HSCs cultured in 3D FCM. (b). The number of differentially expressed genes in Figure 3(a). (c). The top 10 significant signals from the cellular component of Go-enrichment analysis of downregulated genes. (d). The gene expression of podosome-related genes from the RNA-Seq data.
